


Freight broker Landstar System saw truck transportation revenue increase year over year during the second quarter for the first time in 11 quarters. The company also reported that attrition among its core carriers has flattened and that gross additions among the group were the highest in seven quarters.
Landstar (NASDAQ: LSTR) reported second-quarter earnings per share of $1.20 on Tuesday after the market closed. The result was 3 cents ahead of the consensus estimate but 28 cents lower y/y.
Table: Landstar’s key performance indicators
Q2 delivers some good, some bad
Truck revenue increased 1.1% y/y to $1.12 billion as a 1.5% y/y decline in total truck loads was offset by a 2.6% increase in revenue per load. Flatbed and power-only revenue trends were more pronounced across Landstar’s platform, up 5% y/y and 30% y/y, respectively.
Compared to the first quarter, truck revenue was 6.5% higher, with loads and revenue per load increasing equally.
Loads hauled by business capacity owners (BCOs) – owner-operators who haul almost exclusively for Landstar – declined 4.5% y/y but revenue per load increased 3.8%.
(Landstar management views BCO revenue per mile as a more telling metric for TL pricing as it excludes fluctuations in diesel fuel prices.)
Dry van revenue per mile among BCOs stepped slightly higher throughout quarter, up 3% y/y for the entire period. Revenue per mile on flatbed loads hauled by BCOs increased 14% y/y. The flatbed comparisons were positively impacted by a mix shift to higher-priced, heavy-haul freight.
SONAR: Outbound Tender Reject Index for 2025 (blue shaded area), 2024 (green line) and 2023 (pink line). A proxy for truck capacity, the Outbound Tender Reject Index shows the number of loads being rejected by carriers. Current tender rejections are outperforming prior-year levels but still not signaling a recovery. To learn more about SONAR, click here.
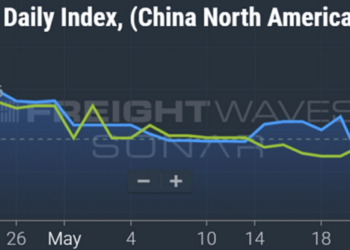
SONAR: National Truckload Index (linehaul only – NTIL) for 2025 (blue shaded area), 2024 (green line) and 2023 (pink line). The NTIL is based on an average of booked spot dry van loads from 250,000 lanes. The NTIL is a seven-day moving average of linehaul spot rates excluding fuel. Spot rates are flat on a y/y comparison.
BCO equipment utilization improved 2% y/y in the quarter and attrition among the group appears to have bottomed.
Net trucks provided by BCOs declined 6.2% y/y to 8,611. But that was just 9 units fewer than in the first quarter and a sign that the market is stabilizing, Landstar management told analysts on a Tuesday evening call. Further, gross BCO additions were the highest in seven quarters, up 12.5% y/y and 9.5% sequentially.
Trucks provided by BCOs declined by just 23 units on a net basis during July.
Total truck capacity on the Landstar platform was off 2.3% y/y.
The company tempered the positive anecdotes, noting the market is still loose. Revenue from loads brokered to Landstar from other truck transportation companies was 19% lower y/y, “a clear indicator that capacity is readily accessible to the marketplace,” management said.
Variable contribution margin, or net revenue margin, was down 20 basis points y/y to 14.1%. (The metric measures revenue remaining after purchases transportation expenses and agent commissions are paid.)
A 33% operating margin (as a percentage of variable contribution) was 580 bps lower y/y. Insurance and claims expenses (as a percentage of BCO revenue) increased 80 bps y/y to 6.6%.
The third quarter is expected to see some sequential cost relief. The second quarter included $4.8 million in charges tied to supply chain fraud. Landstar is hosting a convention in the third quarter but the expenses associated with the event are expected to be $1.5 million less than the cost of a second-quarter convention.
The company called out a potential charge in the third quarter. An independent motor carrier brokered through Landstar subsidiary, Landstar Ranger, was involved in a “tragic vehicular accident” in 2021. A trial regarding the matter is expected to conclude during the quarter.
No Q3 guidance
Given the uncertainty around global trade as well as overall demand choppiness, the company didn’t provide formal guidance for the third quarter. However, it said it normally sees no change in revenue between the second and third quarter, as a slight sequential decline in loads is typically offset by an increase in revenue per load.
If normal seasonal trends hold in the third quarter, revenue for the period would be about 2% light of the $1.24 billion consensus estimate at the time of the print but roughly flat y/y.
July trends showed truck volumes were up 1% y/y while revenue per load was down 3% y/y. The company said it had a super-seasonal June but July had a tough comp to July 2024.
More FreightWaves articles by Todd Maiden:
Losses mount at Pamt, TL unit posts 112.5% OR
Saia beginning to shake off growing pains
Heartland Express books another loss in Q2
The post Landstar reports truck transportation revenue growth for first time in nearly 3 years appeared first on FreightWaves.