
Freight volumes are behaving one way while freight costs are another according to the most recent U.S. Bank Freight Payment Index Rates Edition.
The Index, a quarterly collaboration between U.S. Bank and DAT Freight & Analytics, puts numbers to that gap. Its latest edition shows the truck freight market is repricing from the supply side: capacity tightening and a shrinking contract-to-spot buffer are pushing costs higher before any meaningful recovery in demand has taken hold.
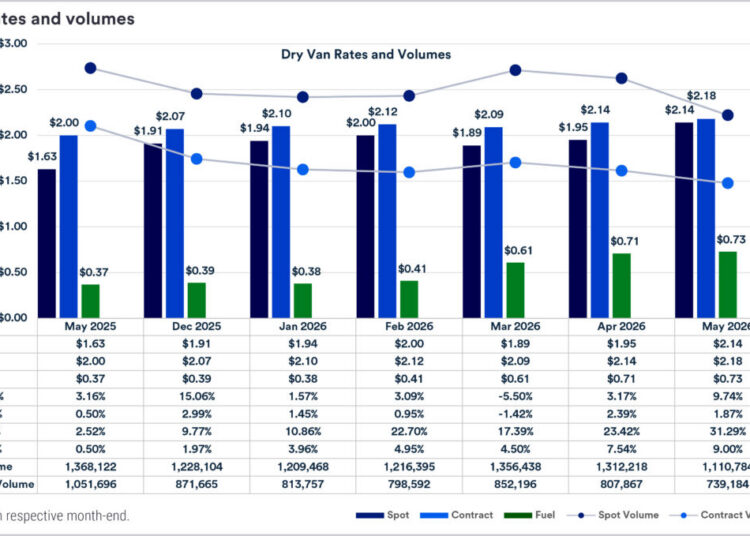
The numbers paint a clear picture. Dry van spot rates hit $2.14 per mile in May 2026, up 31.29% year-over-year and 9.74% month-over-month. Contract rates reached $2.18 per mile, up 9.00% year-over-year. Volumes moved in the opposite direction. Spot shipments fell to 1.11 million in May from 1.31 million in April.
“Freight volumes may appear stable, but costs are telling a different story,” said Alex Terry, director of transportation at Veritiv. “As contract rates catch up to spot pricing, shippers face growing exposure to higher transportation spend.”
(Chart: U.S. Bank / DAT)
The Spread That Defined the Market Reset
One market signal in the report is the compression of the contract freight premium. The spread between contract and spot rates narrowed from approximately $0.39 per mile to about $0.11. This is eliminating most of the cushion shippers have historically used to manage cost exposure.
That compression changes how pricing risk is distributed. As spot rates approach contract levels, routing guide alternatives become less effective. When the buffer disappears, a capacity disruption that would previously have been absorbed by a modest spot premium lands directly on the budget.
The report frames this as a supply-side story. Linehaul pricing has increased more than fuel costs. This indicates that capacity dynamics, not surcharge inflation, are driving the reset. Rates moved higher even as volumes declined. The index describes that divergence as “a clear indicator of a supply-led transition in the market.”
LTL Holds Its Pricing Ground
While truckload grabs the headlines, less-than-truckload pricing has shown a different kind of resilience.
Old Dominion reported first-quarter LTL shipments per day declined 7.9% year-over-year, yet revenue per hundredweight excluding fuel increased 4.4%. XPO posted a similar result, with North American LTL yield excluding fuel up 4.0% and shipments per day rising 3.0%.
Those results show pricing discipline over volume chasing. LTL carriers are holding yield even as freight activity softens. It’s a dynamic the report attributes to the structural mechanics of LTL pricing: revenue per hundredweight frameworks, contract cycles, and freight classification that insulate rates from real-time spot market swings.
U.S. Bank Freight Index Signals Cost Risk for Shippers
The report’s practical takeaway lands directly on shipper budgets. In the current environment, freight can feel operationally stable while transportation spending climbs.
The index recommends monitoring spot-to-contract relationships closely, aligning routing guides with actual carrier behavior, and stress-testing budgets for continued upward pressure in contract pricing.
The warning comes with additional concern: contract rates still have room to move. Spot markets repriced first, and contract rates are following with a lag. That lag does not protect shippers. It only delays when the cost arrives.
“As contract rates continue to catch up to spot, cost exposure may increase even without a corresponding increase in shipment activity,” the report states.
The post U.S. Bank Freight Payment Index shows spot rates surging 31% appeared first on FreightWaves.