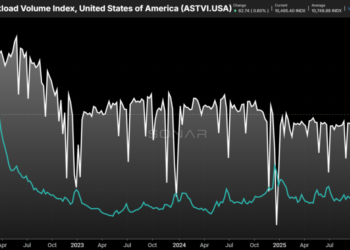


Chart of the Week: Accepted SONAR Truckload Volume Index, SONAR Truckload Rejection Index – USA SONAR: ASTVI.USA, STRI.USA
The recent truckload market tightening has been largely described as supply-driven. While true, this framing overlooks a fundamental principle: all markets are a product of the balance between supply and demand. When analysts say the current tightening is supply-driven, they mean supply is the variable that has shifted most. Looking at the SONAR Accepted Truckload Volume Index (ASTVI) alongside the SONAR Truckload Rejection Index (STRI), we can see that carriers are far less capable of handling current demand volumes than they were just a few years ago.
Accepted tender volumes measure inbound requests that carriers formally agree to cover under a pre-existing rate agreement. This index, paired with tender rejection rates, gives us a reliable read on how well carriers can cover existing requests. In an elevated rejection rate environment like this one (STRI > ~10%), we can safely conclude that carriers lack sufficient capacity to meet existing customer demand.
Tender rejection rates — or inversely, load acceptance rates — are measures of carrier compliance. Carriers have no incentive to increase rejection rates or reduce compliance; unlike rate increases, they know rejections are purely damaging to customer relationships. Simply put, there is no internal motivation to turn down loads, but there is one to raise rates. This makes the rejection rate a cleaner signal of capacity balance than rates alone.
The ASTVI in June 2023 was 10,600, while the STRI sat just above 4%. The most recent weekly ASTVI reading averaged around 10,450, with the STRI above 16%. This suggests carriers are roughly 12–14% underserved relative to demand.
It should also be noted that even in well-supplied markets, a 2–4% rejection rate is normal. Netting the current 16.5% rejection rate against that baseline brings us back to a balanced or oversupplied market.
Demand improved — but not like it has before
Demand shifts can be powerful in both directions. Demand shocks were the primary drivers of the most recent market tightening events in 2017 and 2020 — and while supply conditions matter, demand was the primary catalyst in both cases. When demand increases rapidly, it has the same potential to collapse similarly.
Strong government stimulus was present in both the 2017 and 2020 environments, tender volumes increased ~60% from early March to August in 2020.
These two cyclical shifts were accompanied by freight recessions in the preceding periods. Those recessions pushed carriers into defensive pricing and fleet investment strategies, reducing both rates and fleet sizes.
In the current market, demand has seen a decent uptick over the past year, driven in part by hyperscaling AI data centers, defense spending, and reduced inventories prompting shippers to shorten their order lead times. But this demand growth has not reached the scale seen in 2017 or 2020. Accepted volumes are essentially flat year-over-year, with total tender volumes up around 9% — compared to total tender volumes up ~36% in the back half of 2020 and accepted volumes up around 19%. The recent increase is more subtle and possibly more sustainable.
Supply is slow to move, getting slower
There are still many unknowns and moving parts, both domestically and globally. Shippers have struggled to produce reliable demand forecasts, and uncertainty has been the defining theme of the past 18 months.
The base case, however, keeps demand relatively stable to slightly higher, assuming inflation pressures ease in the coming months. In a relatively unregulated carrier environment — like the one that existed prior to last year — rejection rates fall just over 1% per month as capacity grows at its fastest pace — supply side conditions are much slower to move. At that rate, the market would return to balance in roughly a year if capacity were growing steadily.
But this is not that environment, and there are few signs that carriers are committing to capacity growth. Most large fleets have been reducing capacity through the first quarter of this year, with net changes in operating authorities tracked by the FMCSA remaining deeply negative through April. The Montgomery-Caribe ruling further complicates things as brokers have to be more mindful in their vetting processes, reducing their options beyond simply finding active operators.
Much can change, but anyone expecting a sharp easing or a short-lived tight cycle — based on current data — may be setting themselves up for a difficult second half of the year and start to 2027.
About the Chart of the Week
The FreightWaves Chart of the Week is a chart selection from SONAR that provides an interesting data point to describe the state of the freight markets. A chart is chosen from thousands of potential charts on SONAR to help participants visualize the freight market in real time. Each week a Market Expert will post a chart, along with commentary, live on the front page. After that, the Chart of the Week will be archived on FreightWaves.com for future reference.
SONAR aggregates data from hundreds of sources, presenting the data in charts and maps and providing commentary on what freight market experts want to know about the industry in real time.
The FreightWaves data science and product teams are releasing new datasets each week and enhancing the client experience.
To request a SONAR demo, click here.
The post How long will this truckload market cycle last? appeared first on FreightWaves.