U.S. Bank released its Freight Payment Index on Tuesday, showing that the fourth-quarter freight market saw a slight increase in shipment levels while capacity continued to contract. The capacity contraction pushed shipper spending to its highest level since early 2024, even as freight volumes remained historically low.
For shippers accustomed to a buyer’s market, the data suggests the window may be closing.
The U.S. Bank National Shipments Index posted a modest 1.5% sequential increase from the third quarter but declined 4.9% compared with the same period in 2024. Meanwhile, the National Spend Index surged 4.6% quarter over quarter and rose 5.2% year over year — the first annual spending increase in three years.
One sign of continuing capacity tightening is the widening gap between spending and shipments. This indicates shippers faced substantially higher costs to move only marginally greater volumes of freight.
Capacity squeeze driven by exits and enforcement
Several factors contributed to the capacity crunch in the fourth quarter. Prolonged market downturns prompted carriers to downsize fleets and reduce the number of independent contractors.
The total number of carriers operating also decreased throughout the year. Stricter government regulations added pressure, with tougher English Language Proficiency standards removing thousands of drivers from service.
The Department of Transportation temporarily paused the issuance of non-domiciled commercial driver’s licenses (CDLs) to certain non-citizens and non-permanent residents. The rule potentially affects nearly 194,000 CDL holders, though a court case has suspended its implementation for now. The regulatory environment remains uncertain.
Economic data offered little support for demand recovery. Manufacturing output showed no month-over-month growth for four consecutive months, and the ISM Manufacturing Index reached its lowest level since October 2024 in December. Retail sales through October were flat month over month and rose only minimally above inflation over the past year.
Consumer activity also played a part in dampening demand. Federal Reserve Beige Book reports indicated cautious discretionary spending among middle- and lower-income households, while higher-income groups generally maintained their spending habits, partially offsetting weakness in other segments.
Spot and contract rates climb as fuel costs fall
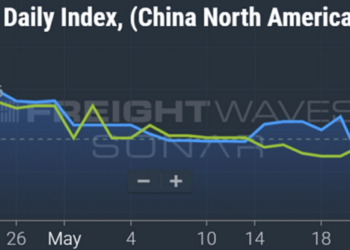
Rate data from DAT Freight & Analytics confirmed the capacity-driven pricing environment. Spot market rates — typically a leading indicator for contract rates — rose an average of 10 cents per mile, a 4.8% increase over the third quarter. Year over year, spot rates gained 5.1%, substantially higher than the 1.4% annual gain in the third quarter.
Contract rates posted 1.4% sequential growth for the second consecutive quarter, with year-over-year increases of 2.9% compared with the fourth quarter of 2024.
Fuel costs did not drive the higher spending. Average fuel expenditures declined 2.9% from the third quarter, dropping 1 cent per mile. The national average price for on-highway diesel fuel was 5.2 cents per gallon lower than the previous quarter. This leaves capacity constraints as the primary driver of elevated costs.
Regional performance mixed
Regional data showed inconsistent recovery patterns.
The Northeast emerged as the top performer, with both quarterly and annual increases in shipments and spending. The Northeast Regional Shipments Index rose 4.2% from the third quarter and 12.1% year over year, while spending increased 5.5% quarter over quarter and 16.7% year over year.
Modest manufacturing improvement in New York state and New England, combined with resilient spending from higher-income households, helped offset reduced spending by lower- and middle-income consumers.
The Southwest faced the greatest challenges, with shipments down 25.4% year over year despite a 5.4% quarterly rebound. The annual shipment average fell 31.6% compared with 2024 — the steepest decline among the five regions.
Despite softer volumes, shipping costs surged due to tighter capacity, likely influenced by stricter English Language Proficiency requirements for drivers. Cross-border movement dipped 0.8% from the quarterly average, and inbound truck traffic from Mexico declined 1.3% compared with October and November 2024 figures. The Federal Reserve Bank of Dallas reported falling retail sales early in the quarter.
The West recorded a slight 1.3% quarterly shipment decline but ended the year 5.4% higher than 2024. The annual average rose 3.2% — notable given declines of more than 16% in both 2023 and 2024. Tariff-related trade policy changes in 2025 boosted import volumes.
Early reports indicated slight dips in seaport and land port volumes from the third quarter. The Port of Los Angeles cited trade policy uncertainty for lower volumes in November and only a minor year-over-year increase in October. Land port truck traffic in October and November was 2.9% below the third-quarter average.
The Midwest posted a 3.5% quarterly shipment increase but remained 3.3% below the prior year — the least severe year-over-year decline among 2025 quarters.
Manufacturing signals were mixed, with the Federal Reserve Bank of Cleveland reporting a minor decline in demand for manufactured goods early in the quarter, while the Federal Reserve Bank of Chicago noted modest improvement in construction, manufacturing and consumer spending.
Besides the West, the Southeast was the only region with consecutive quarterly shipment declines, down 2.4% in the fourth quarter for a two-quarter total drop of 4.4%.
A federal government shutdown likely affected northern parts of the region, where many government employees reduced spending. The Federal Reserve noted declining consumer confidence in the quarter’s first six weeks, reduced new manufacturing orders amid tariff uncertainty, and more cautious discretionary spending from middle- and lower-income households.
Year over year, Southeast shipments dropped 5.9% — the second-largest decline behind the Southwest. Spending rose just 0.7% quarter over quarter (the smallest gain among regions) and 2.3% for the second half of the year (also the lowest).
Outlook points to tighter capacity
The fourth-quarter data confirms a gradual shift toward a moderately tighter market. Capacity contraction drove rates higher despite sluggish demand. For 2025 overall, the index fell 9.9% from the 2024 average — less than half the 20.4% decline seen in 2024. Freight volumes appear to have stabilized near their lowest levels, positioning the market for potential recovery if broader demand strengthens.
The post Freight market tightens in Q4 despite subdued volumes, U.S. Bank data shows appeared first on FreightWaves.