

Truckload linehaul rates surged again in September while shipment counts remained in positive territory, according to a monthly report from Cass Information Systems.
Cass’ TL linehaul index, which tracks rates excluding fuel and accessorial surcharges, increased 10.1% year over year, according to Tuesday data from the payments management company. The dataset was up 0.6% from August to the highest absolute reading in four years.
The linehaul index is historically heavily weighted to contract rates but includes for-hire spot rates. September marked the 21st straight month of y/y growth (12.9% higher on a two-year-stacked comparison).
The report noted the sequential growth rate was 30 basis points below the year-to-date average. It cited a pullback in spot rates and fewer contractual bids “this time of year.”
“Even as spot rates slow with modest sequential declines, the much larger contract market is still adjusting higher.”
September 2026
y/y
2-year
m/m
m/m (SA)Shipments1.9%-3.6%2.3%1.4%Expenditures20.4%23.1%6.7%4.0%TL Linehaul Index10.1%12.9%0.6%NMTable: Cass Information Systems (SA – seasonally adjusted)
Truckload carriers on hand at investor conference last month noted they remained in a position of strength this bid season. Executives believe that the capacity exodus is growing, not slowing, and that the regulatory crackdown will likely remove thousands more unsafe operators. Management teams were also unfazed earlier this summer when the spot market entered its typical seasonal slowdown.
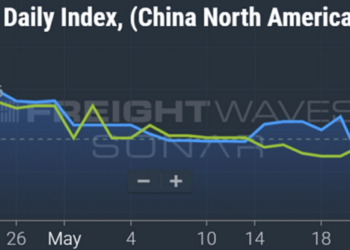
SONAR: Outbound Tender Rejection Index (OTRI.USA) for 2026 (blue shaded area), 2025 (yellow line), 2024 (green line) and 2023 (pink line). A proxy for truck capacity, the tender rejection index shows the number of loads being rejected by carriers. Current tender rejections show a tight truckload market. To learn more about SONAR, click here.
Werner Enterprises’ (NASDAQ: WERN) third-quarter guidance calls for a 10% to 13% y/y increase in rate per total mile at its one-way fleet. Earnings season starts on Thursday when J.B. Hunt Transport Services (NASDAQ: JBHT) reports results after the market closes.
SONAR: National Truckload Index (linehaul only – NTIL.USA) for 2026 (blue shaded area), 2025 (yellow line), 2024 (green line) and 2023 (pink line). The NTIL is based on an average of booked spot dry van loads from 250,000 lanes. The NTIL is a seven-day moving average of linehaul spot rates excluding fuel. Rates remained significantly higher on a y/y comparison in September.
SONAR: Van Contract Rate Per Mile Index (VCRPM1.USA) for 2026 (blue shaded area), 2025 (yellow line), 2024 (green line) and 2023 (pink line). The index shows a 7-day moving average of the initial reporting of dry van contract rates without fuel or accessorial charges.
Freight shipments recorded by Cass increased 1.9% y/y in September. The y/y increase was the second consecutive following 42 months of declines. Shipments were up 2.3% from August (1.4% higher seasonally adjusted).
All domestic transportation modes are included in the index, with TL and less-than-truckload shipments representing the bulk of the dataset. Road-to-rail conversion has weighed on the trucking-centric index in recent months as fuel prices have surged.
“With modest retail and industrial growth, and some inventory restocking as container imports surge, freight demand is recovering,” the report said. “The combination of a smaller private fleet and rising new equipment sales also supports higher for-hire volumes.”
U.S. manufacturing activity remained in positive territory for a ninth straight month during September. The Institute for Supply Management’s Manufacturing PMI registered a 54.5 reading, with the new orders dataset logging a 55.3 reading. (A reading above 50 for the index signals expansion, while one below 50 indicates contraction.)
Cass’ shipments index is forecast to increase 4% y/y in October, assuming normal seasonal patterns hold.
Cass’ expenditures index, which measures total freight spend including fuel, jumped 20.4% y/y (up 6.7% sequentially). An increase in shipments, higher freight rates and surging diesel prices drove the index higher. Diesel prices were up 68% y/y in September, 15% higher than August.
The expenditures index is expected to increase 23% y/y in October.
Data used in the indexes comes from freight bills paid by Cass (NASDAQ: CASS). Cass processes $37 billion in freight payables annually on behalf of customers.
Why it matters? September data from Cass highlights a continued surge in TL contract rates, with only modestly improving demand. The dataset confirms the impact strict regulatory enforcement is having on non-compliant capacity.
More FreightWaves articles by Todd Maiden:
Yellow Corp., Teamsters settle on WARN Act claims
LTL survey: Old Dominion, Daylight Transport take home top honors again
Transportation prices surge as capacity tightens further in September
The post Cass: TL linehaul rates up 10% in September, shipment counts remain positive appeared first on FreightWaves.