Peak season expectations are some of the most currently discussed topics in logistics, but there is another key consumer metric not being considered: back-to-school shopping season.
Just like ordering for the holidays, this season — which usually runs from mid-July through early/mid-September — follows a similar pattern of calendar predictability. The planning and ordering happens at the same time every year.
Calls between shippers and logistics companies are currently underway for back-to-school logistics planning. This period of time could be used as a good barometer for the retail sector’s expectations on consumer spending.
While the logistics industry looks at the totality of volumes being moved during the back-to-school season or peak season, to declare a success you need to dig deep into the metrics in order to understand the future.
To anticipate the true health of the consumer, you need to break out the different verticals within the supply chain. The status of the supply chain is not a black-and-white issue — it’s made of shades of gray. Consumer appetite within product segments of the different verticals will enable companies better ways to manage their inventory.
“We expect back-to-school orders to be similar to last year or have a slight uptick,” said Drew Wilkerson, CEO of RXO, the fourth-largest North American freight broker. “We are seeing a lot of apparel orders.”
Orders for technology are also key for this time. This is the second year that students are back in school full time since the COVID pandemic began.
“We are not seeing any major variances with orders from our customer base,” explained Alan Baer, CEO of OL USA. “Volume from tech companies appears steady.”
Paul Brashier, vice president of drayage and intermodal for ITS Logistics, told American Shipper that year over year, the company is still seeing softness in all aspects of retail.
“We are seeing considerable softness in all segments of back-to-school goods year over year from both retailers and those that are supplying those retailers,” he said. “Volumes are down 30%-35% compared to last year due to significant inventories still sitting in shipper [distribution centers]. Those SKU segments include office supplies, clothing and electronics.
“Though volumes are down considerably, higher-end goods are outperforming discount goods for import volume. This is attributed to the fact that discount retailers are sourcing inventory from the overstock in U.S. [distribution centers] and not overseas, as has been the case in the past.”
No apples-to-apples comparison
As we head into this peak season, the year-over-year (y/y) comparisons will, in reality, be nothing more than splashy headlines and not reflecting true fundamentals. The COVID impact is still backed in. This part of the calendar year is tilted because of the front-loading of holiday items. This resulted in the flat 2022 peak season.
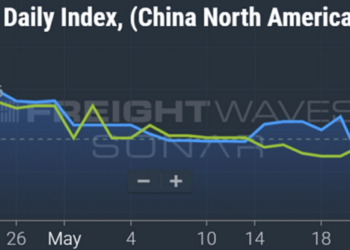
FreightWaves SONAR shows this apples-to-oranges y/y comparison of ocean TEU volumes.
The TEU Volume Index is down 33% and ocean shipments are down 37%. Using 2018 and 2019 data could help provide further clarity when comparing the mindset of today’s consumer.
Breaking out the segments of trade, the types of products ordered and sold will give the world a better sense of how consumers will be spending their dollars. Wilkerson said food and beverage continues to be strong as well as pharmaceuticals.
Another data point to flag is the continued softness in the load-to-truck ratio.
“The load-to-truck ratio 2:1 has not dipped for a sustained amount of time,” Wilkerson said. “I have not called the bottom, but we have to be close to it. More carriers are exiting the market, and that’s good, but not enough have come out to move the needle.”
Bottom line: The more we peel away at the layers of trade data, the better we will be able to understand what kind of spending consumers might make.
The post What to look for as logistics industry preps for back-to-school season appeared first on FreightWaves.


