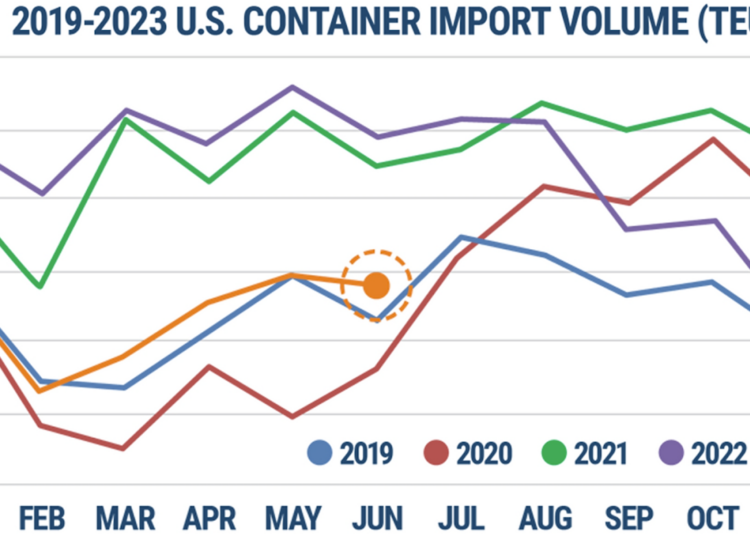
Where is the U.S. recession economists and pundits have been predicting for the past year? There’s no evidence of a recession yet in containerized imports, which continue to track — and remain slightly above — the pre-COVID “normal.”
Descartes reported Monday that imports at all U.S. ports totaled 2,081,793 twenty-foot equivalent units in June, up 6% from June 2019, pre-pandemic. Imports during the first half of this year topped 2019 levels by 2%. Last month’s imports were up 20% from the recent low in February.
Imports traditionally fall in June versus May (excluding the anomalous years during the pandemic). June’s imports edged down 0.7% versus May, a smaller month-on-month decline than usual.
Imports fell by 5.9% in June versus May 2019, by 2.2% in 2018 and 3.5% in 2017, according to Descartes.
Another data source, Global Port Tracker, published by the National Retail Federation and consultancy Hackett Associates, tracks imports to 12 leading U.S. ports using official numbers released by the ports.
Final numbers are not yet in for June, but Global Port Tracker estimates last month’s volumes totalled 1.86 million TEUs for the ports it covers, up 4% from June 2019 and flat versus June 2018.
Global Port Tracker predicts monthly imports will rise to 2.03 million TEUs in August then gradually pull back in the fall. It forecasts that U.S. imports will be 2-3% higher than 2018-2019 levels over the first 11 months of this year.
(Chart: FreightWaves. Data source: National Retail Federation)
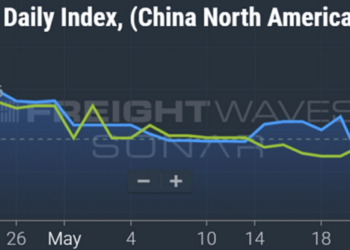
Booking activity up since early May
“Consumer demand is stable and consumers have continued to spend while retailers and wholesalers have reduced their inventories,” said Hackett Associates founder Ben Hackett.
“The prospect of a recession is looking less likely,” he maintained.
Data from FreightWaves SONAR on U.S. import bookings, based on the date of scheduled departure from foreign ports, shows bookings on the rise since early May and tracking above 2019 levels. Bookings covered in the data set that were scheduled for departure on Saturday were the highest since December 2022.
Given transit times from overseas loading ports, this implies continued resilience for U.S imports over the summer months.
Blue line: 2023 bookings. Orange line: 2019 bookings. (Chart: FreightWaves SONAR)
Spot rates in vicinity of pre-COVID levels
How is current demand affecting freight rates, and in turn, ocean carrier revenues?
Spot rates have plunged from stratospheric highs seen during the COVID-era boom, but that was a one-off event. The broader question is how current spot rates relate to those in normal trading conditions prior to the pandemic.
Different index providers have different data sources and use different methodologies. As a result, they give different rate assessments, although they generally trend in the same direction.
The Drewry World Container Index (WCI) shows Asia-U.S. spot rates roughly on par with pre-COVID levels after being above them in May and June. The WCI put average spot rates for Shanghai to Los Angeles at $1,638 per forty-foot equivalent unit in the week ending Thursday, on par with rates during the same week in 2019 and up 7% from 2018.
Average spot rate in USD per FEU. Blue line: 2023. Purple line: 2019. Yellow line: 2018. (Chart: FreightWaves SONAR)
The WCI shows the same pattern on the Shanghai-New York lane: higher-than-normal spot rates in May and June followed by a convergence with pre-COVID levels this month. The WCI Shanghai-New York assessment for the week ending Thursday was $2,590 per FEU, in line with 2018 and 4% below 2019 levels.
Average spot rate in USD per FEU. Blue line: 2023. Purple line: 2019. Yellow line: 2018. (Chart: FreightWaves SONAR)
The Freightos Baltic Daily Index (FBX) shows a more negative trend than Drewry’s WCI.
The FBX China-West Coast spot index fluctuated in the vicinity of 2018-2019 levels in May and June before falling below pre-COVID assessments this month.
As of Friday, the FBX China-West Coast index was at $1,356 per FEU, down 18% from the same time in 2019 and 12% versus 2018.
Average spot rate in USD per FEU. Blue line: 2023. Purple line: 2019. Yellow line: 2018. (Chart: FreightWaves SONAR)
As of Friday, the FBX China-East Coast index was at $2,381 per FEU, 19% below 2019 levels and 12% below 2018.
Average spot rate in USD per FEU. Blue line: 2023. Purple line: 2019. Yellow line: 2018. (Chart: FreightWaves SONAR)
Contract rates still above pre-COVID levels
During the COVID-era boom, ocean carriers’ spot business became more important than usual as long-term customers were forced into the spot market out of necessity.
Since the peak of the boom, the situation has reverted to normal, with cargo booked at contract rates representing a more important share of revenue than cargo booked at spot rates.
Long-term contract rates are tracked by Norway-based Xeneta. According to Xeneta, long-term rates on the Far East-U.S. West Coast lane averaged $1,865 per FEU as of Sunday.
Rate in USD per FEU. Blue line: long-term rates. Yellow line: short-term rates. (Chart: Xeneta)
That’s down 75% from the all-time high in late June 2022 but still 20% above from the average contract rate at this time in 2019, pre-pandemic. Sunday’s long-term average rates were 32% higher than short-term (spot) rates in this lane, according to Xeneta.
Long-term rates in the Far East-U.S. East Coast lane averaged $2,732 per FEU, down 72% from peak in early September 2022 but still 6% higher than the average contract rate at this time in 2019. As of Sunday, long-term average rates were 17% higher than spot rates in this trade, according to Xeneta data.
Rate in USD per FEU. Blue line: long-term rates. Yellow line: short-term rates. (Chart: Xeneta)
OOCL revenue per FEU still above pre-COVID levels
The first shipping line to report detailed results for the second quarter — Cosco subsidiary OOCL — disclosed its revenue per FEU carried on Friday. Steep declines seen in Q4 2022 and Q1 2023 moderated in the latest quarter.
OOCL reported $2,678 in revenue per FEU in the trans-Pacific trade in Q2 2022, up 8% from the same period in 2019 and up 15% versus Q2 2018.
Worldwide, OCCL reported an average of $2,126 in revenue per FEU, up 20% versus Q2 2019 and 23% versus Q2 2018.
(Chart: FreightWaves. Data source: OOCL securities filings)
Click for more articles by Greg Miller
Related articles:
The ‘peak’ of peak season is here
Container shipping trilemma: Weak rates, new ships, pricey charters
Shipping faces fallout as China’s post-COVID rebound falls flat
Container shipping divide: Cargo rates weaken, ship rents ‘robust’
Shipping line Zim gets hammered by high spot-rate exposure
Container shipping under pressure as peak season hopes dim
Shipping boom hangover: When measuring markets gets tricky
The post US containerized imports still outpacing pre-COVID levels appeared first on FreightWaves.


