
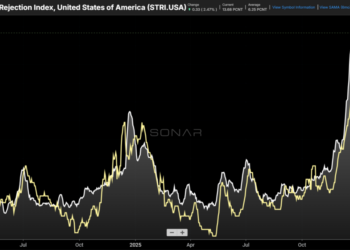

Chart of the Week: SONAR Truckload Rejection Index, National Truckload Index – USA SONAR: STRI.USA, NTI.USA
National tender rejection rates (STRI) have only declined slightly since peaking in early February, while dry van spot rates are rising again as fuel prices surge. The takeaway is that the truckload market may be entering the early stages of a prolonged transitional period, with additional disruption likely from seasonal factors and new regulatory pressures.
What is a tender rejection?
Understanding tender rejections is key to interpreting the truckload market. While spot rates tend to correlate with rejection rates over time, they are heavily influenced by sentiment and the transactional (spot) market, which accounts for roughly 15–30% of total volume. Like financial markets, there is a significant amount of price discovery involved.
Tender rejections, however, are not subject to price discovery. They are simple electronic responses indicating whether carriers have alternative uses for their capacity. Unlike many 3PLs, which dominate the spot market, carriers prioritize utilization over margin expansion. When a carrier rejects a load tender, it typically means either they lack available capacity in the area or they have a more profitable opportunity elsewhere—often both. This makes tender rejections a stronger, more objective signal, as they reflect operational decisions rather than market sentiment.
Not a weather phenomenon
Weather can be a major disruptor in transportation, and it certainly contributed to the elevated rejection rates seen earlier this year. However, these events are typically short-lived. It has now been two months since Winter Storm Fern, and both rejection and spot rates have only declined marginally from their early February peaks.
The SONAR Truckload Rejection Index (STRI) peaked at 14.27% on February 5 and has only fallen to 13.35% at its lowest point as of March 18. Over the past two years, winter weather events have had a more muted impact, with much quicker recovery periods.
Last year, rejection rates peaked at 7.81% on January 15 following several winter storms across the southern and central U.S., before returning to trend by early February. In 2024, a stronger weather event pushed rejection rates to just 5.9% in late January, with a return to trend by the end of February.
This year’s STRI pattern looks very different. It more closely resembles the elevated, prolonged tightening seen in 2021 during the pandemic—albeit at a lower level.
That said, the underlying market dynamics differ significantly. The current environment lacks the strong demand that defined 2021, which was heavily driven by import volumes and port activity. At that time, transcontinental freight was elevated due to severe inventory shortages.
Today’s market is more Midwest-centric, with shippers increasingly shifting long-haul freight back to intermodal. One similarity, however, is the presence of a major February weather event—comparable to the 2021 Texas freeze—that temporarily constrained capacity.
Supply-driven dynamics
Unlike the pandemic period, which was largely demand-driven from a freight perspective, the current market appears to be shaped by a multi-year contraction in truckload capacity. Weak operating economics have forced many carriers out of the market over the past several years, and increased regulatory pressure has accelerated that trend more recently.
Data on the full impact of factors such as ELP enforcement, non-domiciled CDLs, ELD compliance, and questionable CDL issuance is limited. However, some industry estimates suggest the cumulative effect could amount to several hundred thousand drivers.
Looming pressure
The recent rise in spot and rejection rates has occurred with minimal seasonal support so far. Produce season is approaching and has the potential to significantly disrupt transportation markets. Even with limited volumes, rates have already begun to edge higher.
Roadcheck Week has also become a major annual disruptor, often pulling rejection rates out of their lows and helping to kick off the summer shipping season.
Meanwhile, import volumes have been soft both seasonally and relative to the past two years. A rebound or sudden surge in demand could add further upward pressure.
Dalilah’s Law may ultimately be the most significant wildcard, as it has the potential to remove a meaningful amount of truckload capacity in a short period.
With the market already in a relatively tight position, there is little evidence to suggest conditions will loosen in a meaningful or sustained way in the coming months.
About the Chart of the Week
The FreightWaves Chart of the Week is a chart selection from SONAR that provides an interesting data point to describe the state of the freight markets. A chart is chosen from thousands of potential charts on SONAR to help participants visualize the freight market in real time. Each week a Market Expert will post a chart, along with commentary, live on the front page. After that, the Chart of the Week will be archived on FreightWaves.com for future reference.
SONAR aggregates data from hundreds of sources, presenting the data in charts and maps and providing commentary on what freight market experts want to know about the industry in real time.
The post Truckload’s tightness persists into spring appeared first on FreightWaves.