A monthly supply chain survey registered a neutral reading for transportation capacity in June, the first time in more than two years the index didn’t expand. Sentiment around transportation pricing signaled growth for a second consecutive month.
The Logistics Managers’ Index (LMI) displayed a 50 reading for capacity in June. The last nongrowth reading on transportation capacity was in March 2022, just ahead of the freight recession’s onset. The capacity subindex was 7.3 percentage points lower in June than it was in May.
The LMI, a compilation of eight key components of the supply chain, is a diffusion index in which a reading above 50 indicates expansion while one below 50 signals contraction.
Transportation pricing (61) was up 3.2 points sequentially and at its highest level since June 2022. The pricing dataset has been in expansion territory for five of the past six months, closing June 14.5 points higher than it was in the first part of the month.
The pricing subindex was higher than the capacity subindex for a second straight month. This is typically a signal that the freight market is growing.
“If this trend continues — as one might expect with peak season coming — then we would be comfortable calling the end of the freight recession that has gripped the industry since the Spring of 2022,” the Tuesday report said. “The freight recession is not technically over yet, but this is what the beginning of a recovery might look like.”
A surge in ocean shipping spot rates is pushing overall transportation pricing sentiment higher.
The transportation utilization subindex (55.7) fell 3.5 points during the month. Upstream firms (like manufacturers and wholesalers) turned in a reading of 59.2 compared to downstream firms (like retailers), which returned a 46.2 reading.
The one-year-forward outlook for capacity (43.6) calls for contraction while respondents’ expectation for pricing (79.8) was solidly into expansion territory.
“We are not ready to call an end to the freight recession that has gripped the industry for the last two years,” the report said. “However, if respondent future predictions are accurate, peak season materializes, and the trends of the last two months hold, it is likely the freight market will move back into a cycle of growth.”
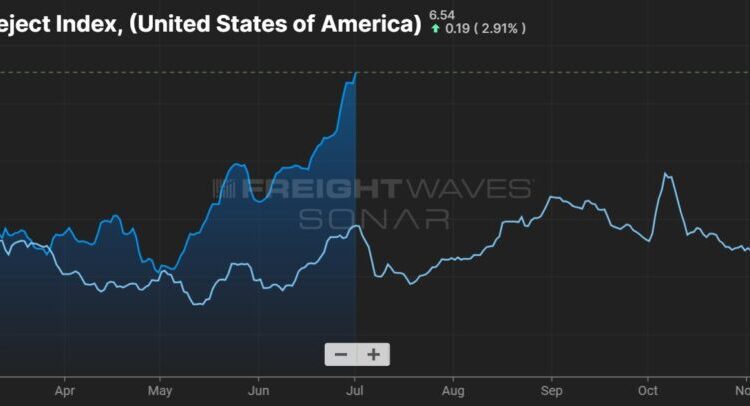
Chart: (SONAR: OTRI.USA). A proxy for truck capacity, the Outbound Tender Reject Index, shows the number of loads being rejected by carriers. Rejections have ticked higher following this year’s Roadcheck in May. To learn more about FreightWaves SONAR, click here.
Chart: (SONAR: NTIL.USA). The National Truckload Index (linehaul only – NTIL) is based on an average of booked spot dry van loads from 250,000 lanes. The NTIL is a seven-day moving average of linehaul spot rates excluding fuel.
The overall LMI logged a 55.3 reading for June, slightly lower sequentially but in expansion territory for a seventh straight month and for 10 of the past 11 months.
Inventory levels (47.4) increased nearly one point but remained in contraction territory while inventory costs (63.6) continued to expand but at a rate that was 1.6 points lower than in May.
The reading on inventories flipped slightly into expansion territory at 51.7 in the second half of the month. Upstream firms were more active, logging a reading of 51.5 compared to downstream companies at 37.
Inventory costs were 11 points higher in the second half of the month.
“Downstream firms running inventories down while the Upstream counterparts build them up likely signals that retailers are attempting to maintain [just-in-time] and keep costs down while their Upstream partners begin the buildup needed for peak season,” the report said.
It also said some shippers could be taking inventory early this year to avoid potential peak season congestion, which could be exacerbated by labor negotiations at the East and Gulf Coast ports.
“Whether or not this will lead shippers to move potential orders forward — trading inventory holding costs for assurances against disruption — remains to be seen,” the report concluded.
The subindex for warehousing capacity (52.6) was down 3 points sequentially and 11 points lower year over year. As the inventory metrics accelerated in the back half of June, the warehouse capacity dataset declined to 48.3.
Warehouse utilization (52.6) dropped 11.4 points from May and was just off the all-time low. The reading for upstream companies was 11 points higher than those downstream. Warehouse pricing (64.5) was largely unchanged in the month, with a similar spread between upstream and downstream respondents.
The LMI is a collaboration among Arizona State University, Colorado State University, Florida Atlantic University, Rutgers University and the University of Nevada, Reno, conducted in conjunction with the Council of Supply Chain Management Professionals.
More FreightWaves articles by Todd Maiden
Forward Air’s recalculated Q1 shows improved leverage ratio
Cold storage REIT Lineage files for IPO
Saia adds terminals in Southern California, Minnesota
The post Transportation capacity in June: No growth for first time in over 2 years appeared first on FreightWaves.


