This week’s FreightWaves Supply Chain Pricing Power Index: 30 (Shippers)
Last week’s FreightWaves Supply Chain Pricing Power Index: 30 (Shippers)
Three-month FreightWaves Supply Chain Pricing Power Index Outlook: 35 (Shippers)
The FreightWaves Supply Chain Pricing Power Index uses the analytics and data in FreightWaves SONAR to analyze the market and estimate the negotiating power for rates between shippers and carriers.
This week’s Pricing Power Index is based on the following indicators:
Bulls and bears are sharply divided
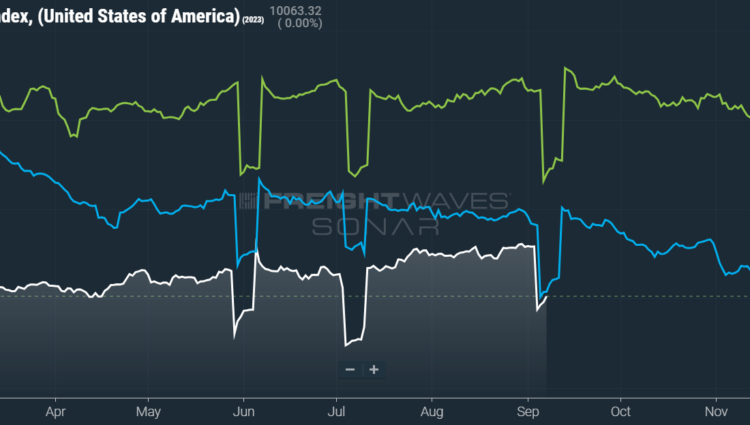
As longtime readers of this column know well, freight demand suffers during the week of a federal holiday. This lull happens because the Outbound Tender Volume Index (OTVI) is calculated as a seven-day moving average. Such holidays, then, are included as a “null day,” bringing the average down for the week of its inclusion. Nevertheless, we can note that shippers’ demand is currently trailing year-ago levels.
SONAR: OTVI.USA: 2023 (white), 2022 (blue) and 2021 (green)
To learn more about FreightWaves SONAR, click here.
Before holidays, OTVI usually ticks up as shippers scramble to get freight out the door. Last week, we did not see any such scramble. So, while OTVI fell 12.06% week over week (w/w), this fall is not as severe as it otherwise might have been. On a year-over-year (y/y) basis, OTVI is down 3.35%, although y/y comparisons can be colored by significant movement in tender rejections. OTVI, which includes both accepted and rejected tenders, can be artificially inflated by an uptick in the Outbound Tender Reject Index (OTRI).
SONAR: CLAV.USA: 2023 (white), 2022 (blue) and 2021 (green)
To learn more about FreightWaves SONAR, click here.
Contract Load Accepted Volume (CLAV) is an index that measures accepted load volumes moving under contracted agreements. In short, it is similar to OTVI but without the rejected tenders. Looking at accepted tender volumes, we see a fall of 14.15% w/w as well as a fall of 1.44% y/y. This y/y difference confirms that actual cracks in freight demand — and not merely OTRI’s y/y decline — are driving OTVI lower, though the y/y gap is narrowing.
Despite all the recent fanfare — which I had joined — about the possibility of a “soft landing,” or taming inflation without triggering a recession, there are numerous risks to an economic recovery. One is the current rally in oil prices, which are responding to additional production cuts by Saudi Arabia and Russia as well as severely low inventories in the U.S. Along with a robust labor market, household spending has been one of the key pillars of a possible soft landing. But if prices for gas and energy continue to rise, especially during the winter travel season, consumer confidence could deteriorate at the worst possible time, threatening both freight demand and the broader economy.
Prices of used vehicles, which have been moderating in recent months, could soon be another upside risk to inflation. As discussed in last week’s column, the threat of a strike by nearly 150,000 members of the United Auto Workers (UAW) labor union grows larger with each passing day. And, despite yearly declines in used car prices, the market remains stable with tight inventories and strong sales. If production of new cars is hamstrung by a UAW strike, used car prices are likely to skyrocket once again. Needless to say, such an increase is the last thing that the Federal Reserve wants to see before its meeting in late September.
SONAR: Outbound Tender Volume Index – Weekly Change (OTVIW).
To learn more about FreightWaves SONAR, click here.
Of the 135 total markets, only 12 reported weekly increases in tender volumes, which is totally to be expected against temporarily unfavorable comps.
But the freight did not stop flowing throughout the Pacific Northwest, thanks mainly to the region’s abundance of produce driving reefer demand. Volumes were up 20.1% w/w in Oregon’s Pendleton market, which includes large swaths of Washington, and 16.1% w/w in the market of Twin Falls, Idaho. Per U.S. Department of Agriculture data, Washington has supplied refrigerated trucks with 340 million pounds of apples and 130 million pounds of onions over the past 30 days, while 221 million pounds of potatoes have moved on reefers out of Idaho in that same period. The time-sensitive nature of produce freight makes reefers a resilient mode when seasonality is favorable, though on the flip side, reefer demand can be hamstrung by poor crop yields and other unforeseen events.
By mode: Despite the aforementioned regional strength of reefer demand over the past week, the national picture is roughly the same for reefers and vans alike. The Reefer Outbound Tender Volume Index (ROTVI) is down 12.61% w/w and 1.87% y/y, as nearly all of the major reefer markets took a hit from the Labor Day lull. So it goes with the Van Outbound Tender Volume Index (VOTVI), which is down 12.18% w/w and a slim 0.94% y/y. Both ROTVI and VOTVI should rebound next week, though dry van volumes for the remainder of the year will be limited by weakened import demand — the Port of New York/New Jersey’s recent success notwithstanding.
Flatbed rejections return to July levels
Rejection rates gathered some promising momentum in the run-up to Labor Day, though these gains are slowly being lost as OTRI trends closer to 4% at present. Of course, the density of holidays in the fourth quarter will provide OTRI with upward pressure, on which carriers will certainly be eager to capitalize. Unfortunately, the only probable way to sustain OTRI at higher levels — absent an unlikely surge in demand — will be for the market to continue shedding excess capacity.
SONAR: OTRI.USA: 2023 (white), 2022 (blue) and 2021 (green)
To learn more about FreightWaves SONAR, click here.
Over the past week, OTRI, which measures relative capacity in the market, fell to 4.23%, a change of 16 basis points (bps) from the week prior. OTRI is now only 134 bps below year-ago levels, with y/y comparisons becoming more favorable even if OTRI only remains stable.
August data for new Class 8 truck orders was released this week, though it paints a relatively blurry picture. On the one hand, orders were down 9% y/y at 19,000 for the month. On the other hand, August is historically a weak month for orders and last month faced unusually difficult comps against 2022, when OEMs began to reopen their order books amid a tidal wave of equipment demand. Lingering effects of the recent semiconductor supply crisis — namely, deficient replacement rates among larger fleets — appear to be compensating for any current demand weakness. Another possible cause behind near-term order strength is the circumvention of California’s upcoming enforcement of its Advanced Clean Fleets regulations.
SONAR: WRI (color)
To learn more about FreightWaves SONAR, click here.
The map above shows the Weighted Rejection Index (WRI), the product of the Outbound Tender Reject Index — Weekly Change and Outbound Tender Market Share, as a way to prioritize rejection rate changes. As capacity is generally finding freight this week, only a few regions posted blue markets, which are usually the ones to focus on.
Of the 135 markets, 60 reported higher rejection rates over the past week, though 27 of those saw increases of only 100 or fewer bps.
Capacity is again tightening in the heavyweight market of Ontario, California, which hosts a network of warehouses and distribution centers that handle imports from the nearby ports of Los Angeles and Long Beach. Ontario’s OTRI is up 173 bps w/w at 5.48%, its highest reading since late March 2022 when freight markets began their rapid decline. Roughly six months ago, only 1.03% of Ontario tenders were being rejected, so this recent spike in the market’s OTRI could signal that the region’s large carrier base is being cut to size.
To learn more about FreightWaves SONAR, click here.
By mode: Mirroring the regional strength in volumes, reefer rejection rates have made significant progress over the past month and a half. The Reefer Outbound Tender Reject Index (ROTRI) hit a year-to-date high of 10.86% on Monday, well above late July’s low of 3.38%. But, as is the case with the overall OTRI, ROTRI’s gains are fading. At present, ROTRI is down 171 bps w/w at 8.45%.
Van rejection rates, meanwhile, continue to be the primary driver behind the overall OTRI’s performance. The Van Outbound Tender Reject Index (VOTRI) has been middling over the past three weeks, currently down 5 bps w/w at 3.8%.
Flatbeds are an interesting, if puzzling, mode. Reflecting the lack of existing homes entering the housing market (thanks to incredibly high mortgage rates), demand for new construction has been rising. In July, housing starts ticked up 4% y/y, with major gains seen in single-family construction (up 6.7% y/y). Yet homebuilders’ outlook for the next six months is dim, as firms fear that persistently high mortgage rates could end up persuading would-be homebuyers to opt for rentals instead.
In late August, the Flatbed Outbound Tender Reject Index (FOTRI) reached a year-to-date low of 5.04%, marking a sour end to the double-digit readings that characterized FOTRI from late 2020 to mid-2023. But FOTRI is now up 293 bps w/w at 9.61%, once again knocking on the door of 10%. Even though pessimism abounds among homebuilders and industrial firms, September is traditionally a strong month for flatbed demand and FOTRI should continue to rise over the coming weeks.
Margins squeezed by rising diesel prices
Diesel prices have been on an unambiguous rally since mid-July, rising nearly 73 cents per gallon over the past nine weeks. With the Department of Energy price sitting at $4.48 per gallon, diesel is at its most costly level since mid-February. Global refining capacity is tight, pushing many refineries to postpone or cancel scheduled maintenance in favor of continuing operations. But this maneuver is risky, as any unexpected disruption to refining capacity caused by mechanical failure could tip the market into absolute chaos.
In the meantime, the national spread between retail and wholesale diesel prices has narrowed significantly since July, with retail prices averaging a premium of only $1.03 per gallon. This narrowing spread makes it difficult for carriers with access to diesel at wholesale prices to make a profit in fuel surcharges, which are typically rated at retail prices.
SONAR: National Truckload Index, 7-day average (white; right axis) and dry van contract rate (green; left axis).
To learn more about FreightWaves SONAR, click here.
This week, the National Truckload Index (NTI) — which includes fuel surcharges and other accessorials — rose 3 cents per mile to $2.30. Rising linehaul rates were entirely responsible for these gains, as the linehaul variant of the NTI (NTIL) — which excludes fuel surcharges and other accessorials — rose 3 cents per mile w/w to $1.61.
Contract rates, which are reported on a two-week delay, are finishing August having recovered all of the month’s earlier losses. But despite a 1-cent-per-mile w/w gain to $2.38, contract rates — which exclude fuel surcharges and other accessorials like the NTIL — are averaging 2.5% lower in Q3 so far than they did in the previous quarter. Outside of the usual seasonal peaks, downward pressure on contract rates will remain for the rest of 2023.
To learn more about FreightWaves SONAR, click here.
The chart above shows the spread between the NTIL and dry van contract rates, revealing the index has fallen to all-time lows in the data set, which dates to early 2019. Throughout that year, contract rates exceeded spot rates, leading to a record number of bankruptcies in the space. Once COVID-19 spread, spot rates reacted quickly, rising to record highs seemingly weekly, while contract rates slowly crept higher throughout 2021.
Despite this spread narrowing significantly early in the year, tightening by 20 cents per mile in January, it has widened again throughout the year to date. As linehaul spot rates remain 81 cents below contract rates, there is still plenty of room for contract rates to decline — or for spot rates to rise — in the remainder of the year.
To learn more about FreightWaves TRAC, click here.
The FreightWaves Trusted Rate Assessment Consortium (TRAC) spot rate from Los Angeles to Dallas, arguably one of the densest freight lanes in the country, has seen a slowdown in its prior momentum. Over the past week, the TRAC rate remained unchanged at $2.09 per mile — still some distance from its year-to-date high of $2.39. The daily NTI (NTID), which has fallen to $2.29, is handily outpacing rates along this lane.
To learn more about FreightWaves TRAC, click here.
On the East Coast, especially out of Atlanta, rates have come down from July’s early peak but are still outpacing the NTID. The FreightWaves TRAC rate from Atlanta to Philadelphia remained unchanged w/w at $2.38. After a bull run that started at the end of April, this lane was plateauing above the national average, which made north-to-south lanes in the East far more attractive than West Coast alternatives.
For more information on FreightWaves’ research, please contact Michael Rudolph at mrudolph@freightwaves.com or Tony Mulvey at tmulvey@freightwaves.com.
The post Markets clock out on Labor Day appeared first on FreightWaves.


