Freight shipments and expenditures in March were largely in line with February, underperforming normal seasonal trends, according to the Cass Freight Index published Monday. The year-over-year (y/y) declines in both data sets eased again during the month.
March shipments were down 2.3% seasonally adjusted from February and 3.6% from the same month last year. Without the seasonal adjustment, March volumes were down 0.2% sequentially. However, February did include one extra day this year.
The shipments index now sits 7.5% below the March 2022 level.
Shipments captured by the index, which is trucking-centric, increased approximately 2% seasonally adjusted from the fourth to the first quarter.
The Monday report pushed back the expectation for a positive volume inflection by one month. The index is expected to decline 2% to 3% y/y in April, turning positive by June.
March 2024
y/y
2-year
m/m
m/m (SA)Shipments-3.6%-7.5%-0.2%-2.3%Expenditures-18.5%-28.3%0.1%-1.3%TL Linehaul Index-4.7%-13.8%0.2%NMTable: Cass Information Systems (SA – seasonally adjusted)
Cass’ expenditures data set, which measures all dollars spent on freight (including fuel surcharges and accessorial charges), fell 1.3% seasonally adjusted from February to March and 18.5% y/y.
Netting out the change in volumes from the change in freight spend implies actual rates were down 15.4% y/y during the month. The subindex for implied rates has been down y/y by midteens to 21% for 10 consecutive months.
Compared to March 2022, total freight expenditures were down 28.3%. The data set is expected to fall 14% y/y in the first half of this year and 9% for the full year.
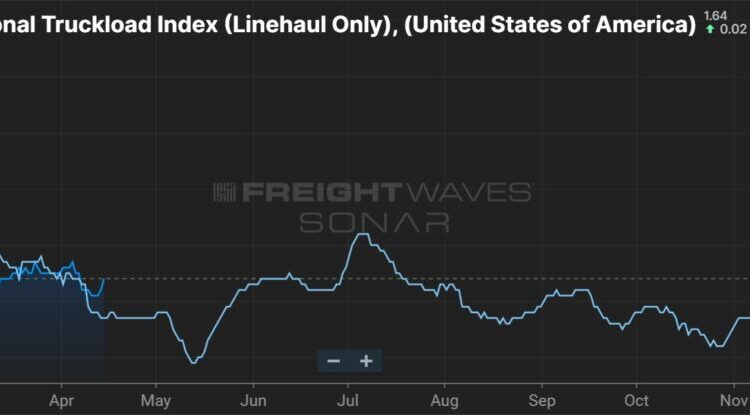
Cass’ truckload linehaul index, which excludes changes in fuel and accessorial charges, increased 0.2% sequentially and was down just 4.7% y/y. The y/y decline was the smallest since December 2022. The TL linehaul index captures changes in both spot and contract rates.
The subindex was down 13.8% on a two-year comparison but has been in a “very tight range” for the past nine months.
“With spot rates steady over the past several months, downward pressure on the larger contract market is lessening, with some instances of contract rate increases bucking the downtrend recently,” the report said.
Chart: (SONAR: NTIL.USA). The National Truckload Index (linehaul only – NTIL) is based on an average of booked spot dry van loads from 250,000 lanes. The NTIL is a seven-day moving average of linehaul spot rates excluding fuel. To learn more about FreightWaves SONAR, click here.
Cass’ March report closes out the first quarter on a down note. In recent weeks, equity analysts have been cutting expectations ahead of the first-quarter earnings season, which J.B. Hunt Transport Services (NASDAQ: JBHT) kicks off Tuesday evening. A tepid backdrop in the overall U.S. industrial complex alongside a massive overhang of available truck capacity appears likely to keep TL rates in check in the near term.
Data used in the Cass indexes is derived from freight bills paid by Cass (NASDAQ: CASS), a provider of payment management solutions. Cass processes roughly $40 billion in freight payables annually on behalf of customers.
More FreightWaves articles by Todd Maiden
WARN Act claims against Yellow may not be settled this year
XPO starts opening terminals acquired from Yellow
Saia starts opening new terminals
The post March freight metrics flat with February, Cass data shows appeared first on FreightWaves.


