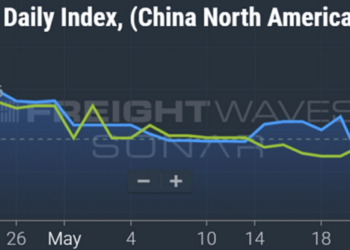
Chart of the Week: National Truckload Index Linehaul Only, Outbound Tender Volume Index – USA SONAR: LCWT1.USA, VCRPM1.USA
Less-than-truckload rates reversed course in June after trending lower this spring, according to FreightWaves’ transportation invoice database. The move comes as the nation’s third-largest LTL provider struggles with coming to an agreement with the Teamsters over operational restructuring and the upcoming labor contract.
The directional shift comes as truckload contract rates continue what has largely been a 12-month decline with no signs of hitting a floor. While it is not clear how much influence the recent Yellow struggles have had on the LTL rate swing, it is a trend worth noting nonetheless.
LTL rates have been increasingly volatile since last fall. This pattern existed in late 2019 as the trucking market was softening. This is due to the fact that rates become more polarized when the market softens as less efficient carriers get more aggressive while stronger operators will maintain rates thanks to better service levels.
LTL rates typically take approximately six to 12 months to respond to the truckload market. The sector is far less fragmented (competitive) than its truckload counterpart and therefore the carriers have more pricing discipline and negotiating leverage, especially on a national level.
Pulling the LTL versus dry van truckload contract rate chart out to a five-year view, the second half of 2019 became increasingly erratic before moderating and starting to trend lower in 2020. Something similar has occurred over the past year, but on a larger scale thanks to the gravity of the pandemic era.
The recent uptick in LTL rates is difficult to tie directly to Yellow because of the volatility of the index and lack of sufficient amount of time to measure. That being said, the index did jump ~20% in the second half of June, right after the Teamsters union announced Yellow was running out of money. This is also a clear divergence in what was a 60-day downward trend.
It has been widely reported that companies are diverting their business away from Yellow to avoid the risk of losing their freight and avoiding service disruptions. Yellow reported a 16% drop in tonnage in April and May, indicating it was already losing business and potentially market share as it was the largest drop of the companies that report on these figures.
With Yellow’s future in question, it puts upward pressure on rates as other carriers may not view this business as permanent or something they can handle regularly. Therefore they will not be as aggressive on offering pricing, at least in the near term. Yellow’s customers’ shipments will fall under a more broad (and elevated) pricing umbrella until there is a more definitive agreement put in place with consistency around volumes.
In the longer run, if Yellow does exit the market, it will also put upward pressure on rates though potentially more muted than they would have been had this occurred a year ago. Yellow has had to drop rates to win business for years as a low-efficiency carrier — the reason it has been pushing for restructuring.
This puts Yellow as a low-cost provider in the industry and if it shuts down, rates will naturally take a step up.
The service disruptions will get ironed out as there is plenty of capacity in the market — probably taking a few months for the dust to settle — but LTL rates will get propped up if the sector loses a top three provider.
About the Chart of the Week
The FreightWaves Chart of the Week is a chart selection from SONAR that provides an interesting data point to describe the state of the freight markets. A chart is chosen from thousands of potential charts on SONAR to help participants visualize the freight market in real time. Each week a Market Expert will post a chart, along with commentary, live on the front page. After that, the Chart of the Week will be archived on FreightWaves.com for future reference.
SONAR aggregates data from hundreds of sources, presenting the data in charts and maps and providing commentary on what freight market experts want to know about the industry in real time.
The FreightWaves data science and product teams are releasing new datasets each week and enhancing the client experience.
To request a SONAR demo, click here.
The post LTL rates bounce as Yellow struggles with union appeared first on FreightWaves.


