On Monday, Georgia Ports released February container volume numbers for the Port of Savannah: total throughput of 451,670 twenty-foot equivalent units, good for 14.4% year-over-year growth. Loaded imports totaling 219,000 TEUs were up 19% year over year, and loaded exports of 121,930 TEUs were 10% above February 2023.
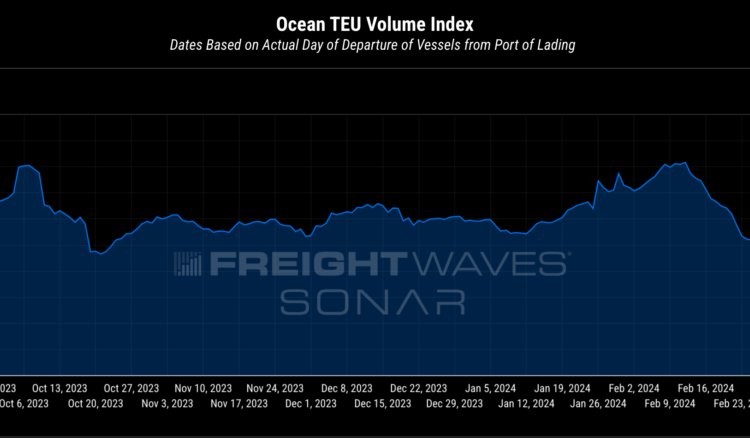
To put the overall volume numbers into context, total throughput was higher than any month in 2023 or 2019; only the pandemic boom times saw higher numbers of containers flow through Savannah. February is typically one of the softest months of the year, and 2024’s February was stronger than the summer and fall peaks last year. Those trends point to growing momentum at the U.S.’s fourth-largest container port — momentum that should continue through March, according to container bookings data available in FreightWaves SONAR.
(The number of container bookings from all global ports bound for Savannah, by day of departure. Chart: FreightWaves SONAR Container Atlas)
The Mason Mega Rail Terminal at Savannah had its best February ever, with 46,890 intermodal lifts representing 39% growth year over year. That number includes imports and exports, loaded and empties, but we can break these numbers down further. Isolating the international container movements on intermodal rail outbound from Savannah shows a similar trend of growing volumes, although the beginning of 2021 saw volume levels that were even higher.
(The number of international 40-foot and 20-foot containers leaving Savannah on intermodal rail, displayed with a 50-day moving average. Chart: FreightWaves SONAR)
Notably, intermodal throughput at the port is still not close to its theoretical maximum of 2 million TEUs per year: The February run rate, annualized, comes out to approximately 561,000 TEUs per year. To generate the most conservative estimate, we could assume that each of the 46,890 intermodal lifts in February was a 40-foot container, or two TEUs; that’s still only 1.1 million TEUs, or a little over half of the Mason Mega terminal’s capacity.
Truckload capacity is tighter in Savannah than the rest of the country: Savannah’s outbound tender rejection rate registered a 5.62% compared to Atlanta’s 2.7% and the national average of 3.94%. Typically, major ports only experience rejection rates higher than the national average when they’re in the middle of a strong upward trend in volumes. In normal conditions, carriers tend to gravitate toward ports as reliable origins for loads, which depresses the number of rejections. Los Angeles, for instance, has a tender rejection rate of 3.15%, nearly 80 basis points below the national average.
Heightened flows at Savannah come as the country’s second-largest retailer, Target, reported Tuesday that its inventories are 11.9% lower than a year ago. Lower inventory levels imply future replenishment and increased demand for transportation services; in particular, lower retail inventories should predict higher loaded imports at container terminals and higher truckload volumes as that freight is moved through national distribution networks.
Similarly, in Walmart’s Q4 earnings call on Feb. 20, management reported lower inventory levels: Walmart U.S. inventories were down 4.5% year over year, and Sam’s Club inventories were more than 8% lower. Ultimately, that’s bullish for import numbers, and Savannah could very well see strong year-over-year growth in March, too.
The post Freight volumes build at the Port of Savannah appeared first on FreightWaves.


