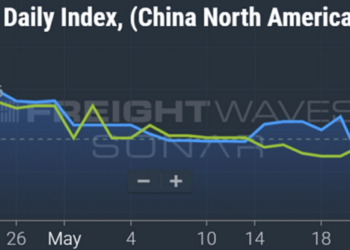
A falloff in container imports into the nation’s West Coast along with weaker domestic trucking volumes pushed J.B. Hunt Transport Services’ first-quarter results lower compared to a year ago.
J.B. Hunt (NASDAQ: JBHT) reported earnings per share of $1.89 Monday after the market closed, 40 cents lower year over year (y/y) and 12 cents below the consensus estimate.
In addition to the softer freight trends, the company contended with EPS headwinds that weren’t there last year. It took a loss disposing equipment versus booking a gain last year. The result was a 17 cent swing. Also, higher interest rates resulted in a 2 cent hit as interest expense was up 18% on a slightly reduced debt load.
Table: J.B. Hunt’s key performance indicators – Consolidated
The effects of what management called a “freight recession” were most notable in the company’s brokerage unit. Revenue in the division was down 42% y/y to $385 million as loads fell 26% and yields were down 22%.
Contractual revenue accounted for 64% of the total compared to just 42% a year ago. Even with a 60-basis-point increase in gross margin, the division booked an operating loss of $5.4 million, a result nearly $30 million worse y/y. A decline in total gross profit dollars due to lower volumes and yields along with higher insurance costs were reasons for the loss.
Management said the spot market appears to be “leveling out” as many carriers are already operating at a loss and can’t absorb further declines in spot rates. “Typically, that can’t last for a long period of time,” President Shelley Simpson said on a call with analysts.
She said the company’s customers are “struggling to forecast what consumers are going to do,” which has resulted in a “more cautious” outlook internally.
Table: J.B. Hunt’s key performance indicators – Brokerage
Chart: (SONAR: NTIL.USA). The National Truckload Index (linehaul only – NTIL) is based on an average of booked spot dry van loads from 250,000 lanes. The NTIL is a seven-day moving average of linehaul spot rates excluding fuel. Spot rates are currently 31% lower y/y. To learn more about FreightWaves SONAR, click here.
A looser trucking market also drove the company’s TL results lower.
Revenue was down 10% y/y to $206 million as revenue per load fell 17%, which was partially offset by an 8% increase in volumes.
The bulk of the division’s loads are moved by independent contractors using J.B. Hunt’s trailers. Average loads per trailer — the unit’s primary metric for asset utilization — were down 24% y/y.
Management said it moved the majority of the remaining portion of its company-owned trucking operations out of the TL segment and into its dedicated unit at the beginning of the year.
The TL segment recorded a 97.6% operating ratio, 1,020 bps worse y/y.
Table: J.B. Hunt’s key performance indicators – TL
Intermodal’s spring to remain coiled
Management often refers to recent intermodal capacity additions as a “coiled spring,” likely producing outsized growth when demand returns. However, that future freight windfall appears likely to remain on the horizon as container imports into the U.S. have been down nearly 30% y/y over the last two months.
J.B. Hunt’s intermodal loadings were down 5% y/y in the period, which was better than the 10% decline in total intermodal traffic on the U.S. Class I railroads, according to the Association of American Railroads.
Transcontinental loads were down 9% y/y as inbound containers to the West Coast have experienced the highest rates of decline. This was partially offset by a 1% increase in Eastern loads, which have a much shorter length of haul. Across the platform, the y/y declines accelerated as the quarter progressed — down 2% in January, down 4% in February and down 8% in March.
Better service from the railroads and customers turning containers faster at their warehouses pushed average box turns nearly 5% higher y/y to five times per quarter. However, average containers in service were 9% lower as 17% of the box fleet was idle due to weakened demand. Revenue per load was up just 1% in the quarter and flat when excluding fuel surcharges.
In total, revenue in the division declined 4% y/y to $1.54 billion.
Table: J.B. Hunt’s key performance indicators – Intermodal
Management noted it won a great deal of intermodal freight in recent negotiations but said those loads have yet to show up in the network. Current bid compliance “is at an all-time low,” approximately in the mid-50% range.
“At this point, our customers have been less accurate than ever before,” said Darren Field, president of intermodal. “I think we’re winning volume that our customers believe that they will have and we’re encouraged by price in that I don’t think that it’s behaved any more challenging than what we expected coming into the year.”
While the network is oversupplied from a capacity standpoint currently, J.B. Hunt will be able to take on another 15% to 20% of incremental volume once demand improves given the recent investments. Future volume wins are expected to amplify the impact of ongoing cost and safety initiatives.
The intermodal division logged an 89% OR, 160 bps worse y/y as costs per load grew 180 bps faster than revenue per load. The bulk of the y/y declines in gains on sale booked during the quarter occurred in the division.
Table: J.B. Hunt’s key performance indicators – Dedicated and Final Mile
More FreightWaves articles by Todd Maiden
Freight shipments, costs sag in March
Container lessor Triton to go private in $13.3B deal
Truckload rates ‘tumbling’ in Q2, report says
Spot market struggles without demand
The post ‘Freight recession’ snares J.B. Hunt in Q1 appeared first on FreightWaves.


