
This week’s FreightWaves Supply Chain Pricing Power Index: 35 (Shippers)
Last week’s FreightWaves Supply Chain Pricing Power Index: 35 (Shippers)
Three-month FreightWaves Supply Chain Pricing Power Index Outlook: 35 (Shippers)
The FreightWaves Supply Chain Pricing Power Index uses the analytics and data in FreightWaves SONAR to analyze the market and estimate the negotiating power for rates between shippers and carriers.
This week’s Pricing Power Index is based on the following indicators:
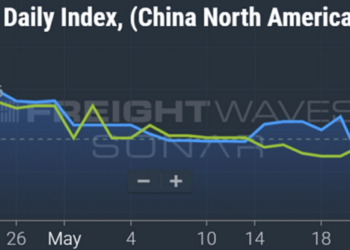
Volumes bucking the post-Memorial Day lull
The freight market continues to experience volume levels well above year-ago levels, maintaining the growth in volumes following the Memorial Day holiday. With container import volumes remaining elevated, it has provided a boost to the truckload market. But just because volume levels have been higher than they were last year, it doesn’t mean that transportation providers have felt the increases, given how much capacity remains in the market.
To learn more about FreightWaves SONAR, click here.
The Outbound Tender Volume Index , which is a measure of national freight demand that tracks shippers’ requests for trucking capacity, is 1.5% lower week over week (w/w) as volume levels are emerging from the Memorial Day holiday. Despite the weekly decline in volumes, OTVI has grown over the past month, rising 4.32% month over month (m/m). OTVI is more than 10% higher than it was this time last year, being driven by inventory contraction and ocean volumes, which have been trending higher since early May.
To learn more about FreightWaves SONAR, click here.
Contract Load Accepted Volume is an index that measures accepted load volumes moving under contracted agreements. In short, it is similar to OTVI but without the rejected tenders. Looking at accepted tender volumes, we see a drop of 1.78% w/w as rejection rates have slightly increased while volumes are slightly lower. CLAV is up 8.23% compared with this time last year, widening the gap with last week’s reading of 7.8%. The smaller growth in CLAV compared with OTVI stems from rejection rates that are nearly double where they were this time last year and rising over the past week. Even though rejection rates are still in deflationary territory, the movement higher has muted the growth in CLAV when compared with OTVI.
In the most recent Bank of America card spending data, spending is slightly stronger than it was this time last year, but it isn’t outpacing inflation. Overall spending through the week ending June 8 was 1.6% higher y/y. Excluding autos, spending growth was slightly slower, up 0.4% y/y, as entertainment and furniture are down double digits y/y. General merchandise saw the strongest growth in spending, rising 3.3% y/y.
To learn more about FreightWaves SONAR, click here.
With freight volumes falling slightly on a national level, most of the freight markets in the country experienced falling volumes as well. Of the 135 freight markets across the country, 52 experienced volume growth over the past week. But even with the majority of markets experiencing volume-levels decline w/w, some of the largest markets in the country experienced growth.
Starting in Southern California, the Ontario market experienced volumes grow by 1.45% w/w, reaching the highest level in more than a year. On the other coast, Harrisburg, Pennsylvania, experienced fairly strong growth w/w as volume levels increased by 3.66%.
To learn more about FreightWaves SONAR, click here.
By Mode: The dry van market has been fairly resilient following Memorial Day, as dry van volumes have dropped by only 0.66% over the past week. In the past month, the Van Outbound Tender Volume Index has increased by 4%, reaching the highest level of the year.
The reefer market has experienced volume levels retreat from the Memorial Day highs. The Reefer Outbound Tender Volume Index declined by more than 5% in the past week to pre-Memorial Day levels. While produce season is in full swing, the reaction appears more in capacity and spot rates, compared with volumes, because produce tends to have extremely short lead times and it often flows directly into the spot market.
Rejection rates tracking like its summer 2019
The freight market continues to battle with excess capacity, but the market is showing signs that outside influences are going to become more impactful. In 2019, capacity was extremely loose. But as carriers exited the market — including Cleadon, which went under at the end of the year — the market became increasingly reactive to outside influences. By the end of 2019, rejection rates eclipsed 14%, setting up 2020 to be a tighter environment, with outside influences (such as COVID) having greater impacts to transportation networks.
To learn more about FreightWaves SONAR, click here.
Over the past week, Outbound Tender Rejection Index, which measures relative capacity in the market, rose to 4.93%, an increase of 27 basis points from the week prior. OTRI is now 178 bps above year-ago levels and tracking closer to 2019 than 2023.
Now just under three weeks away from the Fourth of July holiday, rejection rates are likely to continue to trend higher. With rejection rates likely to eclipse 5% in the coming weeks, it shows that the market has become more balanced. On the capacity front, changes are much slower to happen than on the demand side of the market, so the likelihood of too much capacity exiting the market to service demand adds to the risks of transportation networks over the next six to 12 months.
To learn more about FreightWaves SONAR, click here.
The map above shows the Outbound Tender Reject Index — Weekly Change for the 135 markets across the country. Markets shaded in blue are those where tender rejection rates have increased over the past week, while those in red have seen rejection rates decline. The bolder the color, the larger the change in rejection rates.
Of the 135 markets, 72 reported higher rejection rates over the past week, with the Southeast region experiencing the largest increases in rejection rates across the country.
Tender rejection rates in the Atlanta market, the largest market in the Southeast, experienced rejection rates increase by 83 bps w/w. Farther south in Savannah and Tifton, Georgia, rejection rates increased by more than 500 bps in the past week. The increases are stemming from both reefer and dry van rejection rates, indicating that it isn’t just produce creating a tighter market, but overall market conditions are tightening as well.
To learn more about FreightWaves SONAR, click here.
By mode: Capacity in the dry van market remains the loosest of the equipment types, which isn’t a surprise given the size of the market relative to the others. Over the past week, the Van Outbound Tender Reject Index increased 23 bps to 4.68%, slowing from last week’s growth, but now just 46 bps off the year-to-date high. VOTRI is 182 bps higher than it was this time last year.
Reefer rejection rates have been trending higher since early May as produce season is firmly underway in markets in the Southeast. The Reefer Outbound Tender Reject Index increased by 51 bps over the past week to 7.69%. ROTRI is 257 bps higher than it was this time last year but remains historically low as it continues to be below 10%.
Flatbed remains the most volatile equipment type as the Flatbed Outbound Tender Reject Index has experienced multiple 500-plus bp swings throughout the first half of the year. Over the past week, FOTRI has increased by 234 bps to 16.47%. FOTRI is 455 bps higher than it was this time last year. Eyes for industrial activity turn to the FOMC meetings later in the year for cuts to interest rates, which would likely help drive demand.
Spot rates remain near highest level of the year
Carriers have been able to hold spot rates elevated from International Roadcheck through Memorial Day and into the second week in June. This sets up the second half of the month, leading into the Fourth of July as being one of the best opportunities for carriers to make money, especially because diesel prices have dropped over the past couple of months.
To learn more about FreightWaves SONAR, click here.
This week, the National Truckload Index — which includes fuel surcharge and various accessorials — fell 3 cents per mile to $2.28, but is 5 cents per mile higher than it was a month ago. Linehaul rate declines weren’t as severe as the NTI, as the linehaul variant of the NTI (NTIL) — which excludes fuel surcharges and other accessorials — fell by 2 cents per mile w/w to $1.69, matching Memorial Day levels.
For many, cost savings from transportation have already been felt, and the key in contract negotiations is turning to service. Over the past year, the initially reported dry van contract rate (VCRPM1.USA), which excludes fuel surcharges and accessorials, has fallen by 8 cents per mile to 2.31. But since November, VCRPM1 has been within a 9-cent-per-mile range, excluding the holidays, signaling that while many are still looking for aggressive rate reductions, the overall market has stabilized.
To learn more about FreightWaves SONAR, click here.
The chart above shows the spread between the NTIL and dry van contract rates, which has been trending back toward the pre-pandemic average, though it remains extremely wide. The spread has narrowed by 14 cents per mile over the past year, but spot rates are still 62 cents below contract rates, narrowing one cent per mile over the past week. A continued narrowing of the spread will create an environment that will feel tighter because carriers will believe that they have momentum in pricing.
To learn more about FreightWaves TRAC, click here.
The FreightWaves Trusted Rate Assessment Consortium spot rate from Los Angeles to Dallas experienced its positive momentum stall over the past week. Over the past week, the TRAC spot rate has decreased by 2 cents per mile to $2.16 per mile, one of the highest levels since the decline from the holiday.
To learn more about FreightWaves TRAC, click here.
A similar decline happened from Atlanta to Chicago. The FreightWaves TRAC rate decreased by 2 cents per mile over the past week to $2.09. The spread between contract and spot rates along this lane is just 31 cents per mile.
The post Feels like summer appeared first on FreightWaves.