Chart of the Week: Outbound Tender Volume Index, National Truckload Index – USA SONAR: OTVI.USA, NTI.USA
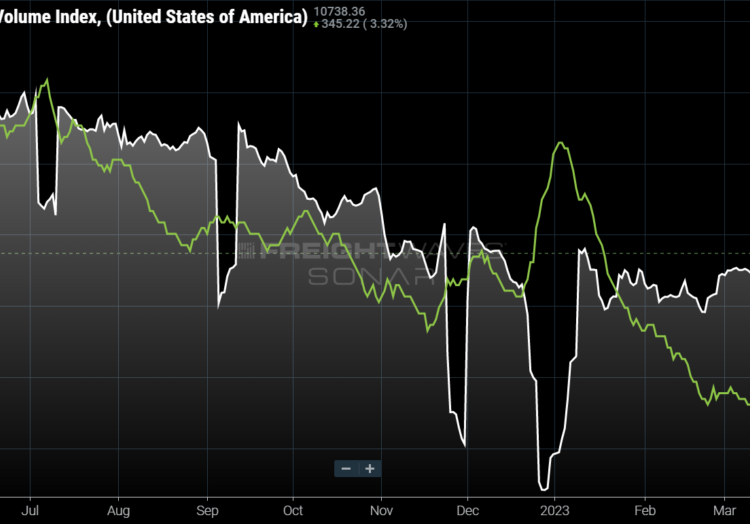
Truckload demand shot up 6% to end April as shipper requests for freight capacity hit their highest levels since the first week of the year. National dry van spot rates (NTI) have flatlined over the past two weeks after plummeting 3.5% to start the month. Could the rising demand and stable spot market be the actualization of the bottom in the data?
Demand increases will likely not be the savior that transportation providers are looking for, but they could stop the bleeding and soften the blow. Since March 7, 2022, tender volumes have dropped 25%, with spot rates falling 33%.
While no one expected the pandemic-era demand boom to persist forever, few thought it would end as abruptly as it did. Many were expecting the deterioration to stop in the first half of the year with some level of recovery in the fall or winter. While tender volumes have leveled off this spring, spot rates have continued to drop.
The problem the trucking market has and continues to have is there are significantly more trucks available than current demand, which is a product of transitioning rapidly from a period in which demand greatly exceeded supply of capacity. The recent demand spikes have had little to no impact on the spot market because of this.
The Outbound Tender Volume Index (OTVI) has increased like this once already this year, rising 6% in the last week of February before trending lower into mid-April. Spot rates only stalled for a moment before dropping an additional 3% through March.
In a more stable environment, a 6% increase in the OTVI would be a significant disruption to capacity. In late May of 2019, the OTVI jumped nearly 7%, which helped push spot rates 6.5% higher over a two-week period.
The recent uptick in OTVI has only managed to keep spot rates from falling further.
The late-April surge is coming from a multitude of origins and not just a few places. This is a sign that general freight demand is getting better from more than a few sectors or industries.
Taking a look at tender volumes by market, 110 of the 135 markets are showing an increase in tenders over the past two weeks. Some of them, like Dallas and Elizabeth, New Jersey, are quite significant.
April is not traditionally a seasonally strong month and has no consistent event that triggers aggregate demand-side increases. Something like this is expected toward the end of March, with the end-of-quarter shipping, or around the upcoming holidays.
Demand may be the only reason spot rates have leveled. Spot rates excluding total estimated fuel costs are only 3% higher than they were in the spring of 2019. It doesn’t take an economist to figure that operating costs have grown more than 3% over the past four years, meaning the spot market consists largely of loads moving at a loss.
And therein lies the rub. While stabilization of rates and demand may be good in itself, it by no means indicates the struggle is over for transportation providers large and small.
Capacity may take a while to come into relative balance with demand, which means several more months of subdued rates and low utilization.
The economic environment is also pretty grim, meaning that this near-term stability may not be a reliable predictor of the future. Investment sentiment is down, and that is working its way into consumption behavior slowly.
Regardless of what this means for the future, it will be something to monitor and take for what it is — a period of less bad that supports a softer economic landing is possible.
About the Chart of the Week
The FreightWaves Chart of the Week is a chart selection from SONAR that provides an interesting data point to describe the state of the freight markets. A chart is chosen from thousands of potential charts on SONAR to help participants visualize the freight market in real time. Each week a Market Expert will post a chart, along with commentary, live on the front page. After that, the Chart of the Week will be archived on FreightWaves.com for future reference.
SONAR aggregates data from hundreds of sources, presenting the data in charts and maps and providing commentary on what freight market experts want to know about the industry in real time.
The FreightWaves data science and product teams are releasing new datasets each week and enhancing the client experience.
To request a SONAR demo, click here.


