The first fatal Houthi attack on a commercial vessel happened earlier this week, claiming three lives. The attacks in the Red Sea have created diversion around the Cape of Good Hope across all of the major container shipping companies, as they opt for the safety of crews and cargo at the expense of shorter transit times.
The result of the diversion has been a surge in global container spot rates of over 200% in a matter of weeks. Rates have reached levels well in excess of what was experienced through the vast majority of 2023. Much of the initial surge, like with the COVID-19 pandemic, was created by the uncertainty of the attacks, both in duration of the conflict as well as severity. As container ships were rerouted around the Cape of Good Hope, transit times ballooned, adding upward of two weeks to transits.
From China to the Netherlands, connecting the major Asian ports to the Port of Rotterdam, the largest port in Europe, transit times have increased by 4.27 days or 10% compared to the same time last year, according to FreightWaves SONAR Container Atlas. While that is a fairly sizable increase, the bigger increase comes from the project44 Ocean Port Pair Delays, which are up 2.54 days compared to the same period last year at 9.5 days. The combination of the two — scheduled transit times of 37.7 days and delays adding 9.5 days — equates to a total transit time of 47.2 days. In comparison, during the week of Oct. 16, scheduled transit times were 32.85 days and delays were just over one day, bringing total transit times to just under 34 days. Total transit times from China to the Netherlands have increased by 39% since the early stages of the Red Sea conflicts.
What does that have to do with ocean spot rates?
Longer transit times mean that container ship companies have to reposition their capacity appropriately to service the same levels of demand. Additionally, shippers are having to act earlier, especially in Europe, to offset the risks of further delays in transit.
This combination of rebalancing of capacity and an effective pull forward of demand creates an environment in which ocean carriers are able to push spot rates up, effectively protecting capacity for contracted shippers.
However, since the initial surge, which also coincided with the pull forward associated with the Lunar New Year, global ocean spot rates have lost momentum.
FreightWaves SONAR. Drewry World Container Index – Global Composite (white) and Freightos Baltic Daily Index – Global (blue)
To learn more about FreightWaves SONAR, click here.
The Drewry World Container Index – Global Composite fell by 4.54% over the past week to $3,493.19 per forty-foot equivalent unit. The Freightos Baltic Daily Index – Global fell by 8.2% to $3,021.73 per FEU.
These declines are an indication that the recovery from China out of the Lunar New Year might be more drawn out as opposed to a swift increase in demand as manufacturing ramps back up.
With the momentum stalling for the ocean carriers, the question now becomes: When will general rate increases be announced and will they be sticky?
FreightWaves SONAR. Freightos Baltic Daily Index from China to the Mediterranean (white), Freightos Baltic Daily Index from China to Northern Europe (green) and Drewry World Container Index from Shanghai to Rotterdam (pink)
To learn more about FreightWaves SONAR, click here.
With the declines happening across the globe, it is important to understand how individual trade lanes are being affected.
In Europe, the declines have varied by destination. The Freightos Baltic Daily Index from China to the Mediterranean dropped by 12.4% over the past week to $4,318.33 per FEU, the lowest they have been this year. The Freightos Baltic Daily Index from China to Northern Europe is down far less, falling 4.4% over the past week to $4,306.68 per FEU.
The Drewry World Container Index from Shanghai to Rotterdam dropped by 7.5% over the past week to $3,650 per FEU.
As with the global composites, the two indices are in agreement that spot rates from China to Europe are declining.
FreightWaves SONAR, Inbound Ocean TEUs Volume Index for the Port of Long Beach, 2024 (white) and 2023 (blue)
To learn more about FreightWaves SONAR, click here.
Along the trans-Pacific, ocean spot rates took a more severe step lower, which is likely an indicator of softer demand following the Lunar New Year.
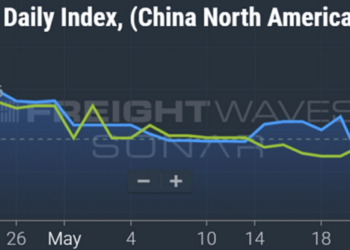
The Freightos Baltic Daily Index from China to the North American west coast fell by 7.8% over the past week to $4,335.94 per FEU, the lowest level in over a month. The Freightos Baltic Daily Index from China to the North American east coast dropped by 9.7% over the past week to $5,981.55 per FEU.
The Drewry World Container Index from Shanghai to Los Angeles fell by 4.8% over the past week to $4,272 per FEU. The Drewry World Container Index from Shanghai to New York fell by 6.2% over the past week to $5,458 per FEU.
With all the indices across the major trade lanes in agreement that ocean spot rates are in decline, what’s the next move for ocean carriers to prevent spot rates from returning to 2023 levels?
The post Carriers’ pricing power slipping amid continued Red Sea conflict appeared first on FreightWaves.


