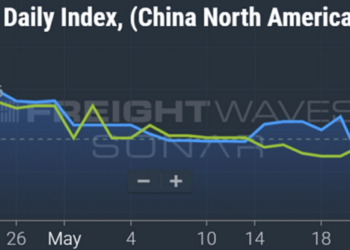




Chart of the Week: SONAR Regional Tender Rejection Rates SONAR: STRI.URMW, STRI.URNW, STRI.URSE, STRI.URSW, STRI.URNE
National tender rejections have eased to about 13.8% over the past two weeks, but that average hides a market splitting in two. The Northwest region’s rejection rate hit 20.27% on Oct. 8. That’s more than triple the 6.2% it posted a year ago and the highest of any region. The Midwest sits right behind it at 18.61%. Every other region falls between 7.6% and 13.1% and is holding flat or drifting lower.
The two regional leaders are getting there in different ways. The Northwest is in a sudden, reefer-driven surge that began in August. The Midwest has been the tightest large region for most of 2026 and isn’t letting up.
The Northwest flipped in eight weeks
The Northwest spent most of 2026 as one of the loosest regions in the country, with rejections between 6% and 9% from January through July. That changed in August. Rejections nearly doubled during the month and have climbed almost every week since.
The split by equipment type tells the story. Northwest reefer rejections have averaged 41% so far in October, up from about 17% in July and 16% last October. Van rejections are under 5%. Reefer tender volume is up 65% since July and 35% year over year, while van volume is down 11% from last year.
Harvest freight meets a thinner fleet
The timing points to the fall produce season. Apple and potato harvests in Washington, Oregon and Idaho ramp up from late August through October, and that freight moves almost entirely in reefers. The same pattern appeared last year, but it came later and was smaller: Northwest rejections didn’t break 10% until mid-November and peaked near 13%.
A bigger crop doesn’t explain the difference. USDA estimates Washington’s 2026 apple crop at 176.2 million bushels, down 2% from last year, and the national crop is down 7% (The Packer).
The Midwest is a different case. Its rejection rate has held near or above 15% since February and is at 18.6% now, compared with 7.6% last October. Tender volume in the region is up about 10% year over year, outpacing the 8% national gain. Unlike in the Northwest, the tightness spans equipment types. Midwest van rejections are near 15%, about two and a half times last year’s level, and reefer rejections are near 29%, up from 15%.
What it means
The Northwest spike is largely a product of regional demand volatility combined with national capacity being meaningfully lower compared to last year. For most of the year, the region generates relatively little outbound freight. Carriers plan for that by limiting contract commitments that would leave their trucks stuck in a market they can’t easily get out of. When harvest freight arrives, there isn’t enough capacity in place to cover it. This effect should fade as the harvest winds down this winter.
The Midwest matters more for the national picture. It’s the largest freight region in the country, and it’s running about five points above the national rejection rate while volume is still growing. That makes it more of a long-term signal: the region has plenty of freight, and carriers have struggled with tender compliance there for nearly a year. Even as the national market has eased, Midwest rejections remain near their spring and summer highs, showing little improvement.
Then there are regions like the Southeast and Southwest, where shippers have turned to intermodal. Domestic intermodal volume through the Atlanta and Dallas hubs was up 15% to 20% year over year this past week. That trend started over the summer, when rejections in those regions peaked.
About the Chart of the Week
The FreightWaves Chart of the Week is a chart selection from SONAR that provides an interesting data point to describe the state of the freight markets. A chart is chosen from thousands of potential charts on SONAR to help participants visualize the freight market in real time. Each week a Market Expert will post a chart, along with commentary, live on the front page. After that, the Chart of the Week will be archived on FreightWaves.com for future reference.
SONAR aggregates data from hundreds of sources, presenting the data in charts and maps and providing commentary on what freight market experts want to know about the industry in real time.
The FreightWaves data science and product teams are releasing new datasets each week and enhancing the client experience.
To request a SONAR demo, click here.
The post The two tightest regions tell two very different stories about the freight market appeared first on FreightWaves.