This week’s FreightWaves Supply Chain Pricing Power Index: 35 (Shippers)
Last week’s FreightWaves Supply Chain Pricing Power Index: 35 (Shippers)
Three-month FreightWaves Supply Chain Pricing Power Index Outlook: 40 (Shippers)
The FreightWaves Supply Chain Pricing Power Index uses the analytics and data in FreightWaves SONAR to analyze the market and estimate the negotiating power for rates between shippers and carriers.
This week’s Pricing Power Index is based on the following indicators:
Volumes recover, holidays likely to shine through for a couple weeks
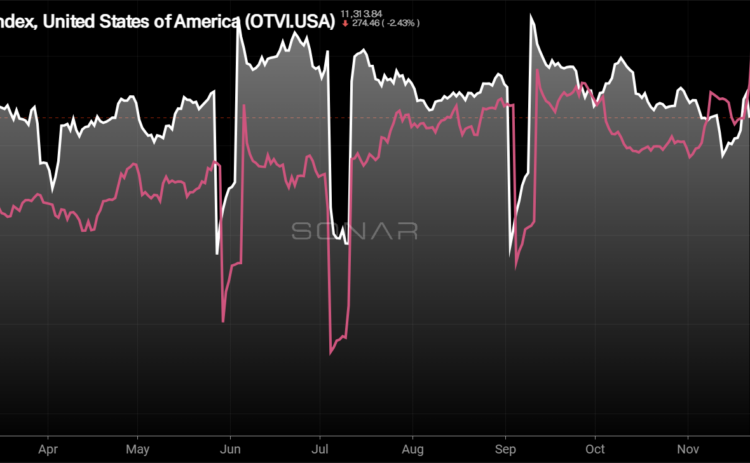
After a sluggish start to November, tender volumes are rebounding just days ahead of the Thanksgiving holiday. The drop in the middle stages of the month appears to be driven by Veterans Day, which tends to not be that impactful to volume levels compared to other holidays. Now with Thanksgiving being later this year than last year, the comps this week will be fairly easy until the back half of the week.
To learn more about SONAR, click here.
The Outbound Tender Volume Index (OTVI), a measure of national freight demand that tracks shippers’ requests for trucking capacity, rebounded this week, rising 2.56% week over week, erasing all of last week’s decline. The OTVI is up over 11% y/y.
Across the mileage band, the growth in volumes continues to be driven by the shortest lengths of haul. Both local and short lengths of haul, loads moving under 100 miles and between 100 and 250 miles, increased by 5.97% and 8.06% w/w.
To learn more about SONAR, click here.
Contract Load Accepted Volume (CLAV) is an index that measures accepted load volumes moving under contracted agreements. In short, it is similar to OTVI but without the rejected tenders. Looking at accepted tender volumes, the decline was slightly smaller than the increase in OTVI, rising 2.31% w/w, driven by an increase in rejection rates over the past week.
Over the past week there were two major retailers that reported earnings that showed fairly sizable differences in the quarter. Walmart, the country’s largest retailer, showed comparable sales up 5.3% y/y while Target reported comp sales up just 0.3%. Target’s management team highlighted a slowdown in discretionary spending as one of the main reasons for the earnings miss, but with Walmart showing growth, it is likely more of a shift to value from consumers.
To learn more about SONAR, click here.
As tender volumes have continued their decline, it is being experienced by the majority of freight markets across the country. Of the 135 freight markets tracked within SONAR, 66 markets experienced volume growth over the past week, up from 55 in last week’s report.
The largest increases in tender volumes continue to be driven by markets that aren’t significantly impactful to the overall freight economy the same as if you saw double-digit growth out of Southern California or markets like Dallas, Atlanta or Chicago. Florida markets, which are back haul markets, actually saw fairly sizable growth including in Miami and Lakeland, where tender volumes were up 29.53% and 14.97%, respectively, w/w.
The largest markets in the country did experience growth over the past week that was more robust than the overall market, but not double-digit growth like the aforementioned markets. Ontario, California experienced tender volumes grow by 4.38% over the past week, while in Atlanta tender volumes were up 3.92% w/w.
To learn more about SONAR, click here.
By mode: The dry van market finally saw some weekly growth in volume levels, but it was against easier comps. The Van Outbound Tender Volume Index increased by 0.75% w/w, which wasn’t enough to offset last week’s decline. Dry van volumes are currently up 8.52% above year-ago levels, but that is against extremely easy comps due to the Thanksgiving holiday.
The reefer market faced continued challenges this week, but the growth in volume since April hasn’t been without volatility along the way. The Reefer Outbound Tender Volume Index fell by 1% over the past week. Reefer volumes are up nearly 10% compared to this time last year, but again need to be viewed with a grain of salt given the timing of the holiday.
Rejection rates are back above 6% ahead of Thanksgiving
Increased volatility has been the theme in recent weeks as tender rejection rates have been bouncing around 6%, which is a vast improvement from the lows of the cycle in May 2023. Tender rejection rates have nearly doubled since the beginning of May this year and have shown signs of seasonality, though even at 6% the market is still fairly loose.
To learn more about SONAR, click here.
Over the past week, the Outbound Tender Reject Index (OTRI), a measure of relative capacity, rose by 23 basis points to 6.11%. The OTRI is 215 bps higher than it was this time last year, showing that capacity has been exiting the market and carriers have slightly more optionality in the market than they did this time last year. The current trend is more similar to what occurred in 2019, but it remains to be seen if tender rejection rates will reach double-digit levels, like in 2019, for the first time in over two years. At present, the OTRI is 37 basis points below 2019 levels.
To learn more about SONAR, click here.
The map above shows the Outbound Tender Reject Index — Weekly Change for the 135 markets across the country. Markets shaded in blue and white are those where tender rejection rates have increased over the past week, whereas those in red have seen rejection rates decline. The bolder the color, the more significant the change.
Of the 135 markets, 75 reported higher rejection rates over the past week, up from the 64 that saw tender rejection rates rise in last week’s report.
The Salt Lake City market, which is a backhaul market in nature, has seen tender rejection rates soar over the past week, having the third largest increase across the country, just behind Green River, Wyoming and Twin Falls, Idaho. Tender rejection rates in Salt Lake City have increased by 428 bps over the past week, eclipsing 10%.
To learn more about SONAR, click here.
By mode: The dry van market is finally experiencing some level of volatility as dry van tender rejection rates have risen to the highest level since the Fourth of July. The Van Outbound Tender Reject Index increased by 48 bps over the past week to 5.58%. Compared to this time last year, dry van tender rejection rates are up 218 bps.
The breakout in reefer tender rejection rates has slowed in November, but continue to be well above where they have been throughout much of the year. The Reefer Outbound Tender Reject Index fell by 33 basis points over the past week to 15.89%. Reefer tender rejection rates are still 579 bps higher than they were this time last year, a further indication that the reefer market has risen out of its recession.
There hasn’t been a shot in the arm for the flatbed sector in November like there was in October, though the Federal Open Market Committee did opted to lower the target range for the federal funds rate at the beginning of the month. The decline in interest rates tends to have a lagging impact on the economy, so it will likely help boost industries like manufacturing and housing in 2025, but is likely too late to help in 2024. With that said, flatbed tender rejection rates have rebounded over the past week. The Flatbed Outbound Tender Reject tIndex increased by 178 bps throughout the past week to 12.16%. Flatbed tender rejection rates are 65 bps higher than they were this time last year.
Spot rates remain elevated entering the holiday season
With tender rejection rates trending in a positive direction overall, spot rates have started to follow suit. After a sizable increase to start November, which is fairly unseasonal, the spot market rates have remained elevated ahead of the holiday season. With less than a week until the Thanksgiving holiday, the elevated state of spot rates will create a higher baseline heading into the final six weeks of the year, which tends to see fairly sizable increases, even during the freight recession of 2022-2024.
To learn more about SONAR, click here.
This week, the National Truckload Index – which includes fuel surcharge and various accessorials – saw another increase, rising by 2 cents per mile, following last week’s 1-cent-per-mile increase, to $2.37 per mile. The NTI is now 10 cents per mile higher than it was this time last year, but as previously mentioned, with the Thanksgiving holiday being slightly earlier than this year, the impacts are showing up earlier. The linehaul variant of the NTI (NTIL) – which excludes fuel surcharges and other accessorials – increased at the same rate as the NTI, signaling that the underlying rate increased and changes to fuel prices weren’t a driver. The NTIL rose by 2 cents per mile to $1.82. The NTIL is 22 cents per mile higher than it was this time last year, a sign of how impactful the decline in diesel fuel prices has been as a rate deflator for all-in spot rates. The average diesel price at truck stops is down 16.8% compared to this time last year.
Initially reported dry van contract rates, which exclude fuel, have remained fairly stable the past couple of months, as shippers have become more understanding over the past year that pricing could shift significantly. Over the past week, the initially reported dry van contract rate was unchanged at $2.33. Initially reported dry van contract rates are 3 cents per mile higher than they were this time last year.
To learn more about SONAR, click here.
The chart above shows the spread between the NTIL and dry van contract rates is trending back to pre-pandemic levels. The spread remains wide, but with the recent positive momentum in spot rates and flattening of contract rates, the spread is narrowing over the long term. Over the past week, the spread between contract and spot rates narrowed by 12 cents per mile, and it is 23 cents narrower than it was this time last year.
To learn more about SONAR, click here.
The SONAR Trusted Rate Assessment Consortium spot rate from Los Angeles to Dallas continues to trend higher, but not without some volatility along the way. The TRAC rate from Los Angeles to Dallas increased by 6 cents per mile to $2.68. Spot rates along this lane are 18 cents per mile above the contract at present.
To learn more about SONAR, click here.
From Chicago to Atlanta, spot rates have been volatile but really haven’t moved significantly since the beginning of the month. The TRAC rate for this lane fell by 2 cents per mile over the past week to $2.68, after rising slightly in last week’s report. Spot rates are 4 cents per mile below the contract rate, but that spread is as narrow as it has been all year.
The post Is Thanksgiving going to disrupt the status quo? appeared first on FreightWaves.


