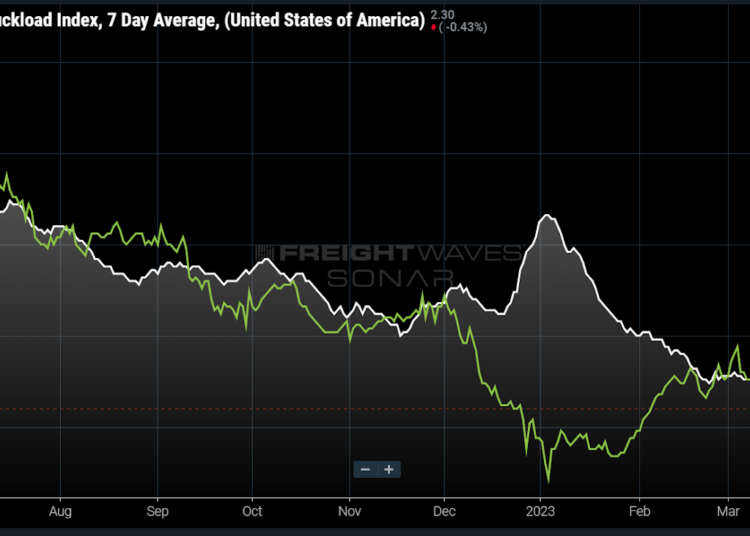
Chart of the Week: National Truckload Index, National Truckload Index Forecast, National Truckload Index Forecast 28-day Historical – USA SONAR: NTI.USA, NTIF.USA, NTIF28.USA
At a time when many trucking operators are gearing up for seasonal demand, many upstream signals are implying continued deterioration in rates is coming. FreightWaves National Truckload Index Forecast (NTIF) is predicting a ~9% drop in dry van spot rates over the next month. The silver lining for transportation providers is that this could be the theoretical bottom they have been looking for.
The truckload spot market is considered one of the best near-term indicators of market conditions. Spot rates are negotiated and executed mostly in a 48-hour window, reflecting the market value of transportation in a very near time manner.
Spot rates are extremely volatile and can move up or down rapidly as demand conditions change relative to supply. From the beginning of March to early May of last year, spot rates fell 13%. During the same period fuel costs — a component of the rate — jumped over 35%. Removing the influence of fuel (NTIL), spot rates actually fell 22%.
Forecast faltering
Forecasting is not an exact science and is generally measured in terms of how it deviates from the outcome versus accuracy. Understanding what drives the forecast is what is most important to deriving insight.
The NTI forecast is currently based on variables that have been identified as having the best predictive insight on spot rate movements such as imports, fuel and historical rate data. Not all of this information is a direct correlation and it should be noted that it had a strong deviation around the holidays.
The 28-day historic forecast value (NTIF28) represented in the green line in the main chart is the predicted value for the NTI 28 days prior. The forecast produces new values each day based on new information and 28 days is the furthest out it predicts.
The holiday deviation can be explained by the unusually strong downward move in imports and fuel overriding the upward seasonal pressure. One of the flaws of forecasting rates alone is the fact it ignores volume.
Rates did increase on average during the holidays but volumes were down, meaning that noncontracted and loads that had elevated service expectations had a stronger representation.
The Outbound Tender Reject Index, which measures the rate at which carriers reject contract load tenders, was at an all-time low high of 5.5% during the holidays, meaning there was not a significant overflow of freight moving from contract to spot as in years past.
While the forecast of the average rate was off, it did a pretty good job of predicting that capacity would be relatively easy to attain. The takeaway here is that the forecast is predicting a very soft April even if rates do not fall as fast as the prediction.
Predicting perfection
Since the holiday miss, the NTIF has returned to glory at the 28-day mark. Its predictive accuracy has been remarkable since mid-February, even better than it was last year. It called the minor uptick in rates that hit at the end of the month and quarter.
There is the possibility that the algorithm is overvaluing some of the strongest historical drops in spot rates in recent history during the pandemic era. The NTI fell nearly 8% in 2021 and 2022 and more than 23% during the initial COVID-19 wave in 2020. It is hard to imagine this level of drop is feasible at this point, and this is where many forecasts falter as they struggle with too much complexity.
Looking toward the end of the forecast, it does appear to show some leveling. Historically, April is a relatively slow month, with May and June becoming much more active. This could mean April will be the bottom to the spot market as consolidation and exits are expected to move supply more in line with demand throughout the year and stabilize rates.
About the Chart of the Week
The FreightWaves Chart of the Week is a chart selection from SONAR that provides an interesting data point to describe the state of the freight markets. A chart is chosen from thousands of potential charts on SONAR to help participants visualize the freight market in real time. Each week a Market Expert will post a chart, along with commentary, live on the front page. After that, the Chart of the Week will be archived on FreightWaves.com for future reference.
SONAR aggregates data from hundreds of sources, presenting the data in charts and maps and providing commentary on what freight market experts want to know about the industry in real time.
The FreightWaves data science and product teams are releasing new datasets each week and enhancing the client experience.
To request a SONAR demo, click here.
The post Truckload spot market may bottom in April appeared first on FreightWaves.