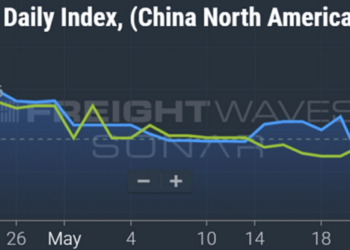
Chart of the Week: Outbound Tender Volume Index, National Truckload Index linehaul only – USA SONAR: OTVI.USA, NTIL.USA
Outbound tender volumes (OTVI) surged over 7.1% from May 26 to June 3, marking one of the strongest demand surges to start the summer shipping season since 2019. The spike in tender volume appears to have helped sustain spot rates excluding estimated fuel costs (NTIL) at relatively elevated levels beyond the Memorial Day holiday period.
The Outbound Tender Volume index measures the total number of electronic requests from shipper to carrier. It biases heavily toward the contract freight market, which consists of long-term rate agreements between larger carriers and larger shippers. It also leans heavily on dry van and refrigerated freight.
The domestic truckload market has been in an extreme state of oversupply since the first half of 2022, when the impacts of COVID on supply chains and demand began to wane. Transportation service providers have been experiencing an industry wide recession for about the same period of time and are waiting for any sign that the market is turning.
Volumes tend to jump this time of the year, increasing between 0.3% and 6.8% over the past four years, but they jumped 8.8% in 2019, in a historically down market.
So while the tender volume jump was the largest in several years, it has not pushed rates higher proportionally — it has more sustained the level. The reason for this lack of rate jump is largely that there is still enough capacity to handle it.
The more positive news is probably the spot rate figure, which has been averaging about 4%-7% higher year over year since early May. Until that point, rates had been largely lower than they were in 2023 through most of the winter and spring.
International Roadcheck and Memorial Day appeared to help push rates higher, and that has sustained through the first week of June. The recent two-month period of year-over-year spot rate growth has been the longest since early 2022.
Baby steps
The solid takeaway is that the market has shifted directionally, meaning things are not getting worse from a transportation service provider perspective. There is still a long way to go before transportation companies can breathe more easily, however.
Signs of a more balanced environment will manifest in the form of tender rejection rates — the percentage of tenders where carriers turn down the request from shippers to move their freight (OTRI) — being between about 5% and 7% during nonholiday periods. This tends to be the place where carriers have enough leverage to price their services above cost thresholds and shippers can enjoy a more predictable long-term sourcing situation. Looking at rejection rates over the past six years, that appears to be a rare occurrence.
Rejection rates are still below 5%, even with the recent demand bump, but they are trending higher. Considering this summer shipping pattern of increased demand tends to last for approximately a month and a half, service providers may get only a temporary boost before the July lull hits, pending some sort of exogenous event like a hurricane.
Comparing 2024 rejection rate patterns to 2019, the markets look eerily similar over the past few weeks, indicating that we may have finally entered the tailing edge of the capacity exodus. While these two markets are not exactly the same, the 2019 OTRI pattern looks like a decent blueprint to use for what to expect for the rest of the year if economic conditions remain the same.
About the Chart of the Week
The FreightWaves Chart of the Week is a chart selection from SONAR that provides an interesting data point to describe the state of the freight markets. A chart is chosen from thousands of potential charts on SONAR to help participants visualize the freight market in real time. Each week a Market Expert will post a chart, along with commentary, live on the front page. After that, the Chart of the Week will be archived on FreightWaves.com for future reference.
SONAR aggregates data from hundreds of sources, presenting the data in charts and maps and providing commentary on what freight market experts want to know about the industry in real time.
The FreightWaves data science and product teams are releasing new datasets each week and enhancing the client experience.
To request a SONAR demo, click here.
The post Summer shipping demand lifts truckload market appeared first on FreightWaves.


