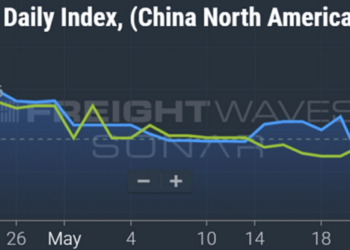
Chart of the Week: Reefer Outbound Tender Reject Index – Florida, USDA Produce Spot Rate – Lakeland to Chicago, Lakeland to Boston SONAR: ROTRI.FL, AGRATE.LALCHI. AGRATE.LALBOS
Refrigerated tender rejection rates for loads originating in Florida topped 5% this past week for the first time since July 2022.
The spiking rejection rates coincided with jumping spot rates for produce truckload moves, something that occurs regularly this time of year for the region. The big takeaway is that spot rates and rejections are creating new highs in what has been an extremely soft truckload market.
Produce freight is very niche within transportation. It requires an added layer of regulation since it is a food-grade product. One example of this is that trailers that haul chemicals cannot also haul produce.
What’s more, produce haulers have to drive into areas that are not necessarily easy to navigate and have a narrow window to ensure the freight is fresh and unspoiled. Most of the time this means an insulated, temperature-controlled (reefer) trailer is required.
In addition to all these added layers of complexity and subsequent cost, produce harvests are somewhat erratic. However, the payouts tend to be much larger than those for the average dry van or contract reefer load. This means that carriers will prioritize covering these loads when it is time for harvest — leading to increasing tender rejection and spot rates.
According to the U.S. Department of Agriculture, the average spot price for hauling produce from central Florida to Chicago (AGRATE.LALCHI) has jumped from $2,147 in early April to $3,400 — 58% in three weeks. Produce-hauling spot rates from Florida to Boston have grown from $3,400 to $5,500 in the same period. Both values are near or above 2023 highs with potentially more to go in the season.
By weight, watermelon, potatoes, corn, tomatoes and peppers account for the bulk of the produce, according to the USDA. But there is also the added component of Mother’s Day flowers that is not included in the government data.
Most of the flowers for Mother’s Day bouquets are imported from South America and land in Florida. Flowers are extremely delicate and require very controlled conditions with exacting service requirements, which also carry a high price tag for transporting.
Market reactivity appears to have increased over the past year as this normally short-lived seasonal trend has exceeded the previous year’s levels.
The aggregate freight market remains in a strong state of oversupply, and this includes the less-serviced refrigerated sector. National reefer rejection rates are just above 4% at the time of this article. That is historically low but well above the 2.7% value last year at this time.
Florida is normally one of the easiest places to source trucking capacity due to the lack of production in relation to consumption. The state takes more than it makes, meaning more trucks are moving in than out of the state regularly.
These types of seasonal reactions will be important to monitor as aggregate capacity continues to erode. The overall market may remain in a state of strong softness for the next few months, but pockets of strong destabilization will be on the rise while the supply and demand move toward equilibrium.
P.S. Support the Florida trucking market and don’t forget your moms this week.
About the Chart of the Week
The FreightWaves Chart of the Week is a chart selection from SONAR that provides an interesting data point to describe the state of the freight markets. A chart is chosen from thousands of potential charts on SONAR to help participants visualize the freight market in real time. Each week a Market Expert will post a chart, along with commentary, live on the front page. After that, the Chart of the Week will be archived on FreightWaves.com for future reference.
SONAR aggregates data from hundreds of sources, presenting the data in charts and maps and providing commentary on what freight market experts want to know about the industry in real time.
The FreightWaves data science and product teams are releasing new datasets each week and enhancing the client experience.
To request a SONAR demo, click here.
The post It’s Florida season appeared first on FreightWaves.


