The freight market is suffering from very challenging conditions and few dispute that the freight market is in recession.
The root cause of the current freight recession has been the imbalance of supply and demand.
Let’s break down demand first:
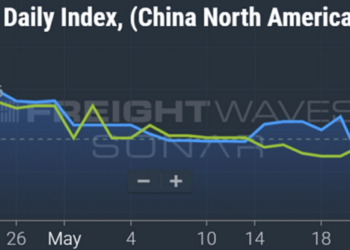
According to SONAR’s Outbound Tender Volume Index, or OTVI, freight volumes are currently up 16% over 2019 levels. Volumes are at some of the highest levels of the year to date.
Although the peak season began slowly, over the past week, things appear to be turning. To date, peak season certainly has not been robust, but it also has not been abysmal.
The macro outlook, capacity and OTRI
Next up, we need to look at capacity.
While there are good datasets that track total aggregate capacity, the data painfully lags the market because it is government generated. So, there’s no precise measurement of the total number of trucks currently available for dispatch.
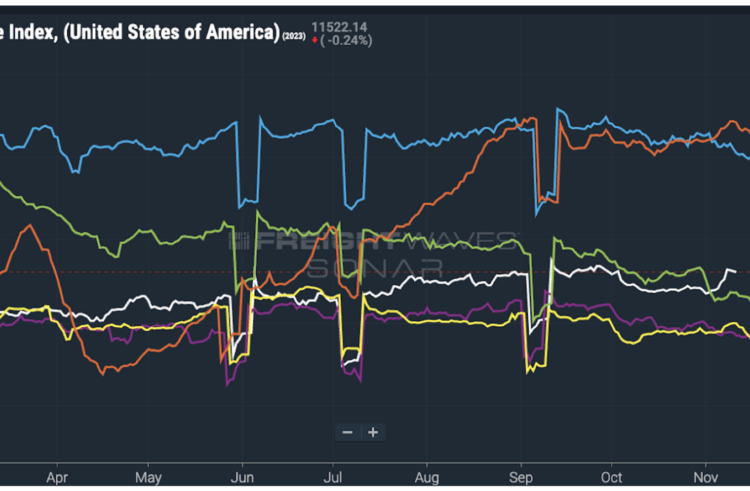
To address this issue, FreightWaves developed the Outbound Tender Rejection Index, or OTRI. The index measures the number of truckload orders rejected during the previous week.
And whatever the state of the economy, there has always been and will always be a level of rejection in the market.
But with the data OTRI provides, there is an indicator for how full the truckload order book is at any moment in time.
Since FreightWaves first published the OTRI in 2018, it has ranged from 2.5% to 30%.
Currently, SONAR’s OTRI is at 3.5% — low by historical standards.
Like airlines, trucking companies strive to overbook their capacity. So, trucking companies reject a percentage of loads every day, just like airlines bump passengers from their airplanes when a flight is too full.
These rejections happen electronically via computer messages called “EDI” or “API” message protocols. These messages are sent from trucking companies in response to orders for capacity from shippers of all kinds — retailers, manufacturers and industrial firms.
In SONAR, all of the data that would identify a specific company is stripped, so no one ever knows which specific company ordered a truck or which carrier rejected a specific load. This is done to protect the confidentiality of SONAR participants.
When gauging the health of the U.S. freight market as a whole, SONAR data is focused on the market’s breadth, not what takes place at individual companies.
The freight economy at road level
Since its inception, FreightWaves has reported the good and bad news about the freight economy. We also report what is happening at the companies that make up the freight economy, because these companies and their employees are the key to moving the nation’s goods.
And despite the industry’s importance to the overall economy, at the company level, bankruptcies, closures and downsizings have occurred at large and small companies for more than a year and a half.
Overcapacity is the primary problem
But while there are certainly a number of problems, the “freight recession” is due primarily to too much capacity — or for the layperson, too many trucks for the amount of freight being moved.
Freight volumes are more robust than would be expected had there been a sharp economic recession, but there are real problems stemming from too much capacity in the market.
And while the goods economy is not nearly as robust as it has been in previous years, the softness in freight is a capacity issue, not a demand issue.
Interested in the data presented in this article? Sign up for a demo of SONAR by FreightWaves.
The post Two charts explain why we’re in a freight recession appeared first on FreightWaves.