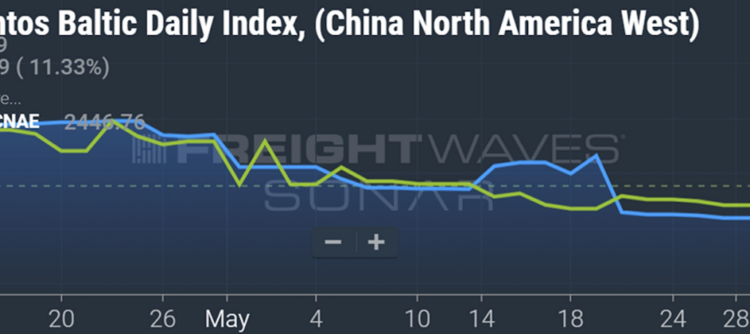
Shipping lines have brought Asia-U.S. spot rates up off the floor, but it’s a slog: two steps up, one step back, another two steps up, a slide back again.
The general rate increase (GRI) on Thursday was partially successful, clawing back some ground lost after the April 15 GRI.
According to the Freightos Baltic Daily Index (FBX), China-West Coast spot rates were $1,441 per forty-foot equivalent unit on Friday, up 11% from prior to Thursday’s GRI and up 44% from prior to the April 15 GRI.
The FBX index put China-East Coast rates at $2,448 per FEU on Friday, up 6% since the most recent GRI and 17% since the April 15 GRI.
Blue line: Spot rate in USD per FEU, China-West Coast. Green line: China-East Coast. (Chart: FreightWaves SONAR)
The Shanghai Containerized Freight Index rose 5% in the week ending Friday versus the prior week. Linerlytica said Monday that the SCFI rose “on the back of the June 1 trans-Pacific increases,” while “sentiment remains poor” globally and other trade lanes are “under significant pressure.”
Platts said Monday that the market remains bearish “despite a general rate increase for North American imports from the Far East on June 1 that offered temporary relief to the weak spot market.” Platts’ spot-rate assessments from North Asia and Southeast Asia to both U.S. coasts inched up last week as a result of GRIs.
But market participants told Platts cargo demand can’t support spot rate increases and the expectation is for rates to slide back again. “It’s a good strategy at the end of the day,” a freight forwarding source told Platts. “If [carriers] ask for $500 and get $100, they will take it. It’s better than just watching the rates drop.”
Annual contract rates plunge, as expected
The normalization of spot rates and cargo volumes to pre-COVID levels was expected by ocean carriers after one-off pandemic factors eased. Another expectation was that annual trans-Pacific contracts for the May 1, 2023, to April 30, 2024, period would sink back toward normal price levels. That too has come to pass.
Norway-based Xeneta collects data on both long-term and short-term (spot) rates. It put average long-term rates on the Far East-West Coast route at $2,025 per FEU on Monday. That’s down 52% from the end of April as a result of new annual contracts coming into force in May.
Average long-term rates on this route were 3.7 times higher ($7,545 per FEU) at their peak a year ago. Nevertheless, the current long-term average is still up 30% versus this time in 2019, pre-COVID, according to Xeneta data.
(Chart: Xeneta)
Xeneta put average short-term rates on the Far East-West Coast route at $1,454 per FEU as of Monday, matching pre-COVID levels.
The current long-term average is $571 per FEU or 39% higher than the short-term average, implying carriers have had at least some success in propping up revenues in the face of weak demand, given that a higher share of their volume is on contract.
The pattern is the same in the Far East-East Coast lane. Xeneta assessed current average long-term rates at $3,235 per FEU. These rates plunged 52% from late April as new annual contract rates took effect.
Peak long-term rates on this route, in August 2022, were triple current rates. However, current average long-term rates in the Far East-East Coast trade are 28% higher than pre-COVID levels and $797 per FEU or 33% higher than current average short-term rates, according to Xeneta data.
(Chart: Xeneta)
Peak season ahead
The consensus of ocean carriers and ports is that there will be at least a moderate bump in peak-season volumes as seasonal goods are shipped, in line with typical pre-COVID patterns, which should provide some support to spot rates through summer and early fall, but no fireworks. Hopes of a significant demand rebound have dimmed.
During an online presentation Monday, Hapag-Lloyd CEO Rolf Habben Jansen said on contract renewals: “People have been pushing out [the timeline for] making commitments, but by and large, the contract commitments [volumes] we have secured are fairly comparable to what we had last year.
“The market has normalized and there was definitely subdued demand in Q4 and Q1, but there is a little bit of a recovery now,” said Habben Jansen.
Bookings data shows at least some improvement from the lows, which might indicate the beginning of a normal seasonal increase.
The proprietary bookings index of FreightWaves SONAR’s Container Atlas — which measures bookings bound for the U.S. from all destinations as of the scheduled date of departure — was at 121 points on Monday (100 is indexed to Jan. 1, 2019), near the high for this year and in line with the levels at this time in 2019, pre-COVID.
(Chart: FreightWaves SONAR Container Atlas)
Click for more articles by Greg Miller
Related articles:
West Coast container ports hit as labor talks take ominous turn
Container shipping under pressure as peak season hopes dim
Shipping boom hangover: When measuring markets gets tricky
US imports up again in April as market mirrors pre-COVID ‘normal’
Shipping line Zim gets hammered by high spot-rate exposure
Hapag-Lloyd: Higher costs will inevitably push up shipping rates
Maersk: Downturn on predicted course, liners acting ‘rationally’
The post Trans-Pacific spot container shipping rates are inching up appeared first on FreightWaves.


