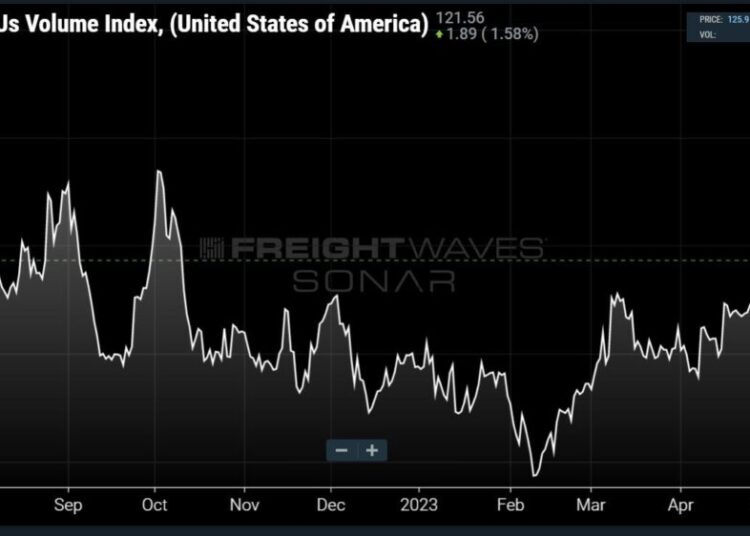
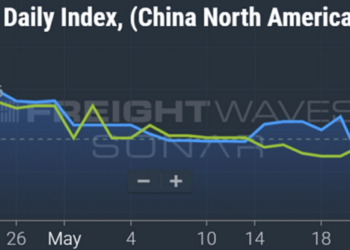
Exactly one year ago, SONAR’s ocean container bookings data revealed that U.S. import demand for containerized goods was dropping off a cliff, and while that same bookings data is still trending right alongside 2019 levels (as we forecast), the weakening global macroeconomic backdrop is continuing to add further downside risks to volumes. With U.S. importers likely as cautious as ever before in bringing in new volumes during the second half of 2023, it is increasingly likely that U.S. import demand is again positioned for new declines and destined to find a new bottom in the second half.
In the chart above, the latest ocean container bookings data from SONAR reveals that U.S. containerized import volumes have reached an eight-month high. While this recent boost is a welcome signal to anyone hoping for a rebound in U.S. import volumes, it can also be misleading unless viewed in the context of the past four years of U.S. containerized import volumes, which we have in the chart below.
As we previously forecast, ocean container bookings in the first half of 2023 (white line) have continued trending right alongside 2019 levels (orange line). This is expected to continue through early Q3, at which point we will likely begin to see a detaching from 2019 levels to the downside, with 2023 volumes dropping noticeably below. From there, U.S. containerized import volumes will begin retesting the lows reached during Chinese New Year of this year, dropping below those levels during late Q3/early Q4 to find a new bottom, ultimately resulting in a significant drop of 10% to 20% below second-half 2019 levels. Below is a chart of what that decline of 10% (orange) to 20% (red) in monthly loaded import TEUs would look like across the Top 10 U.S. ports.
With our bearish projections for U.S. containerized import volumes, it is also likely that ocean container spot prices could reach a new bottom as well. In the chart below, we can use 2019 container volumes from China to the U.S. as a proxy to better understand how container spot rates are likely to behave moving forward through the end of 2023. With volumes remaining relatively flat throughout 2019 from China to the U.S., with no noticeable uptick during peak season, ocean container spot rates remained between $1,250-$1,500 from China/East Asia to the U.S. West Coast and $2,500-$3,000 from China/East Asia to the U.S. East Coast for the entirety of the year (after the initial Q1 declines), according to the Freightos Baltic Index.
If volumes indeed decline and follow our projections for the second half of 2023, then it is possible that ocean container spot rates could reach new lows as well. As we see in the chart below, the floor that has been established so far in 2023 puts ocean container spot rates currently between $1,000 and $1,700 from China/East Asia to the U.S. West Coast and $2,000-$2,550 from China/East Asia to the U.S. East Coast, according to the Freightos Baltic Index. So, if volumes were to remain relatively flat for the remainder of 2023, then it is reasonable to assume that ocean container spot rates could behave similarly to the way that they behaved in the second half of 2019. However, given our projected declines, unless ocean carriers are truly able to effectively control capacity on the supply side, the downward pressure on spot rates will be immense, and it is highly likely that a new floor could be found in ocean container spot rates as well.
From the trade war to COVID to record high freight rates to the backside of the “bullwhip effect” with inventories at major U.S. importers remaining high, and now, a shift in consumer spending toward necessities rather than discretionary goods, U.S. importers are likely going to be as cautious as they have ever been in bringing in new volumes in the second half. This reality, coupled with the weakening global macroeconomic backdrop, is only adding to the downside risks to volumes that now exist. While it may not be a proverbial “cliff,” it is increasingly likely that U.S. import demand is once again positioned for new declines, and destined to find a new bottom in the second half of 2023.
The post US import demand positioned to find a new bottom in 2023 appeared first on FreightWaves.


