Freight market conditions are improving.
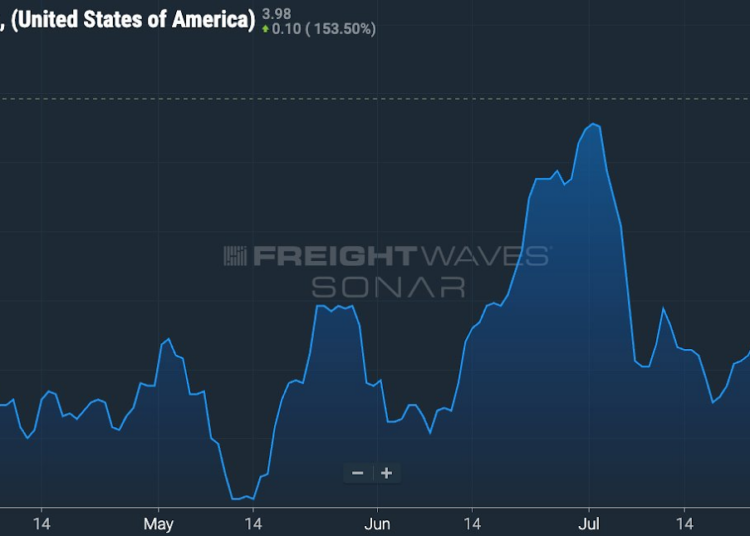
Let’s start with the FreightWaves SONAR Outbound Tender Rejection Index (OTRI). This measures the percentage of truckloads that are turned down by trucking firms in the market. It’s an anonymized measurement of midsize to large truckload carriers’ willingness to accept the loads that are offered. OTRI is the best way to measure supply and demand.
Tender rejections are at 4%, which is the highest level in six months.
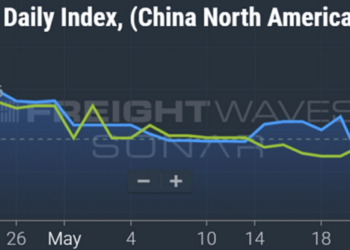
The FreightWaves SONAR Outbound Tender Volume Index (OTVI) measures electronic offers from shippers to truckload carriers for the transport of goods.
OTVI has been increasing throughout the year; the big dips in the chart below are when holidays occurred. Over the past six months, volumes are up 12%.
For most of the year, tender rejections didn’t reflect these higher volumes. This indicated that there was too much capacity in the market — too many trucks chasing the available freight loads.
However, that has changed in the past month. In the past 30 days, tender rejections are up 26%, while volumes are only up 1%.
Capacity has been bleeding out of the market. Carriers large and small have been leaving the industry, meaning there are fewer trucks available to haul freight.
Trucking companies have different operating costs, but none of them can survive long on low rates. Throughout this year, truckload spot rates have hovered between $1.50 and as high as $2.10 a mile. Meanwhile, the average breakeven cost per mile for truckload ranges from $1.56 to $1.90 per mile, according to a recent J.P. Morgan study.
Combined with the low freight rates, trucking companies have been hurt by higher diesel prices.
What’s next?
Assuming that higher volumes remain persistent and capacity continues to leave the market, higher freight rates are on the way.
Shippers have enjoyed lower freight rates since the spring of 2022. However, rates are cyclical and shippers should play defense now by locking in contract rates or moving to index-linked freight contracts.
All charts in the article are available on the FreightWaves SONAR high-frequency data platform. To set up a demo, check out SONAR.FreightWaves.com
The post 6 charts reveal freight industry is bouncing back appeared first on FreightWaves.